26 Monitoring and troubleshooting errors with logging
26 使用日志记录监控和排除错误
This chapter covers
本章涵盖
• Understanding the components of a log message
了解日志消息的组成部分
• Writing logs to multiple output locations
将日志写入多个输出位置
• Controlling log verbosity in different environments using filtering
使用筛选控制不同环境中的日志详细程度
• Using structured logging to make logs searchable
使用结构化日志记录使日志可搜索
Logging is one of those topics that seems unnecessary, right up until you desperately need it! There’s nothing more frustrating than finding a problem that you can reproduce only in production and then discovering there are no logs to help you debug it.
日志记录是那些似乎不必要的主题之一,直到您迫切需要它为止!没有什么比找到只能在生产环境中重现的问题,然后发现没有日志可以帮助您调试它更令人沮丧的了。
Logging is the process of recording events or activities in an app, and it often involves writing a record to a console, a file, the Windows Event Log, or some other system. You can record anything in a log message, though there are generally two different types of messages:
日志记录是在应用程序中记录事件或活动的过程,它通常涉及将记录写入控制台、文件、Windows 事件日志或其他系统。您可以在日志消息中记录任何内容,但通常有两种不同类型的消息:
• Informational messages—A standard event occurred: a user logged in, a product was placed in a shopping cart, or a new post was created on a blogging app.
信息性消息 - 发生标准事件:用户登录、产品放入购物车或在博客应用程序上创建新帖子。
• Warnings and errors—An error or unexpected condition occurred: a user had a negative total in the shopping cart, or an exception occurred.
警告和错误 - 发生错误或意外情况:用户购物车中的总数为负数,或发生异常。
Historically, a common problem with logging in larger applications was that each library and framework would generate logs in a slightly different format, if at all. When an error occurred in your app and you were trying to diagnose it, this inconsistency made it harder to connect the dots in your app to get the full picture and understand the problem.
从历史上看,在大型应用程序中登录的一个常见问题是,每个库和框架都会以略有不同的格式生成日志(如果有的话)。当您的应用程序发生错误并且您尝试诊断它时,这种不一致使得您更难将应用程序中的各个点连接起来以获得完整的图片并了解问题。
Luckily, ASP.NET Core includes a new generic logging interface that you can plug into. It’s used throughout the ASP.NET Core framework code itself, as well as by third-party libraries, and you can easily use it to create logs in your own code. With the ASP.NET Core logging framework, you can control the verbosity of logs coming from each part of your code, including the framework and libraries, and you can write the log output to any destination that plugs into the framework.
幸运的是,ASP.NET Core 包含一个可以插入的新通用日志记录接口。它在整个 ASP.NET Core 框架代码本身以及第三方库中使用,您可以轻松地使用它在自己的代码中创建日志。使用 ASP.NET Core 日志记录框架,您可以控制来自代码每个部分(包括框架和库)的日志的详细程度,并且可以将日志输出写入插入框架的任何目标。
In this chapter I cover the .NET logging framework ASP.NET Core uses in detail, and I explain how you can use it to record events and diagnose errors in your own apps. In section 26.1 I’ll describe the architecture of the logging framework. You’ll learn how dependency injection (DI) makes it easy for both libraries and apps to create log messages, as well as to write those logs to multiple destinations.
在本章中,我将详细介绍 Core 使用的 .NET 日志记录框架 ASP.NET 并说明如何使用它来记录事件和诊断您自己的应用程序中的错误。在 Section 26.1 中,我将描述 logging 框架的架构。您将了解依赖关系注入 (DI) 如何使库和应用程序轻松创建日志消息,以及将这些日志写入多个目标。
In section 26.2 you’ll learn how to write your own log messages in your apps with the ILogger interface. We’ll break down the anatomy of a typical log record and look at its properties, such as the log level, category, and message.
在第 26.2 节中,您将学习如何使用 ILogger 接口在应用程序中编写自己的日志消息。我们将分解典型日志记录的剖析,并查看其属性,例如日志级别、类别和消息。
Writing logs is useful only if you can read them, so in section 26.3 you’ll learn how to add logging providers to your application. Logging providers control where your app writes your log messages, such as to the console, to a file, or even to an external service.
只有当您可以阅读日志时,编写日志才有用,因此在 Section 26.3 中,您将学习如何将日志记录提供程序添加到您的应用程序中。日志记录提供程序控制应用程序将日志消息写入何处,例如写入控制台、文件甚至外部服务。
Logging is an important part of any application, but determining how much logging is enough can be a tricky question. On one hand, you want to provide sufficient information to be able to diagnose any problems. On the other hand, you don’t want to fill your logs with data that makes it hard to find the important information when you need it. Even worse, what is sufficient in development might be far too much once you’re running in production.
日志记录是任何应用程序的重要组成部分,但确定多少日志记录就足够了可能是一个棘手的问题。一方面,您希望提供足够的信息以便能够诊断任何问题。另一方面,您不希望在日志中填充数据,从而在需要时难以找到重要信息。更糟糕的是,一旦你在生产环境中运行,开发中足够的资源可能就太多了。
In section 26.4 I’ll explain how you can filter log messages from various sections of your app, such as the ASP.NET Core infrastructure libraries, so that your logging providers write only the important messages. This lets you keep that balance between extensive logging in development and writing only important logs in production.
在 Section 26.4 中,我将解释如何过滤来自应用程序各个部分的日志消息,例如 ASP.NET Core 基础设施库,以便日志记录提供程序仅写入重要消息。这使您可以在 development 中的大量日志记录和在 production 中仅写入重要日志之间保持平衡。
In the final section of this chapter I’ll touch on some of the benefits of structured logging, an approach to logging that you can use with some providers for the ASP.NET Core logging framework. Structured logging involves attaching data to log messages as key-value pairs to make it easier to search and query logs. You might attach a unique customer ID to every log message generated by your app, for example. Finding all the log messages associated with a user is much simpler with this approach, compared with recording the customer ID in an inconsistent manner as part of the log message.
在本章的最后一节中,我将介绍结构化日志记录的一些好处,结构化日志记录是一种日志记录方法,您可以将其与 ASP.NET Core 日志记录框架的某些提供程序一起使用。结构化日志记录涉及将数据作为键值对附加到日志消息中,以便更轻松地搜索和查询日志。例如,您可以将唯一的客户 ID 附加到应用程序生成的每条日志消息中。与以不一致的方式将客户 ID 记录为日志消息的一部分相比,使用此方法查找与用户关联的所有日志消息要简单得多。
We’ll start this chapter by digging into what logging involves and why your future self will thank you for using logging effectively in your application. Then we’ll look at the pieces of the ASP.NET Core logging framework you’ll use directly in your apps and how they fit together.
在本章开始时,我们将深入研究日志记录涉及什么,以及为什么未来的自己会感谢您在应用程序中有效地使用日志记录。然后,我们将了解您将直接在应用程序中使用的 ASP.NET Core 日志记录框架的各个部分,以及它们如何组合在一起。
26.1 Using logging effectively in a production app
26.1 在 生产应用程序中有效地使用日志记录
Imagine you’ve just deployed a new app to production when a customer calls saying that they’re getting an error message using your app. How would you identify what caused the problem? You could ask the customer what steps they were taking and potentially try to re-create the error yourself, but if that doesn’t work, you’re left trawling through the code, trying to spot errors with nothing else to go on.
假设您刚刚将一个新应用程序部署到生产环境中,这时客户打电话说他们在使用您的应用时收到了一条错误消息。您将如何确定导致问题的原因?您可以询问客户他们正在采取哪些步骤,并可能尝试自己重新创建错误,但如果这不起作用,您就只能浏览代码,试图发现错误,而没有其他事情可做。
Logging can provide the extra context you need to quickly diagnose a problem. Arguably, the most important logs capture the details about the error itself, but the events that led to the error can be equally useful in diagnosing the cause of an error.
日志记录可以提供快速诊断问题所需的额外上下文。可以说,最重要的日志捕获了有关错误本身的详细信息,但导致错误的事件在诊断错误原因方面同样有用。
There are many reasons for adding logging to an application, but typically, the reasons fall into one of three categories:
向应用程序添加日志记录的原因有很多,但通常,原因分为以下三类之一:
• Logging for auditing or analytics reasons, to trace when events have occurred
出于审核或分析原因进行日志记录,以跟踪事件发生的时间
• Logging errors
记录错误
• Logging nonerror events to provide a breadcrumb trail of events when an error does occur
记录非错误事件,以便在发生错误时提供事件的痕迹导航跟踪
The first of these reasons is simple. You may be required to keep a record of every time a user logs in, for example, or you may want to keep track of how many times a particular API method is called. Logging is an easy way to record the behavior of your app by writing a message to the log every time an interesting event occurs.
第一个原因很简单。例如,您可能需要保留用户每次登录的记录,或者您可能希望跟踪特定 API 方法被调用的次数。日志记录是一种记录应用程序行为的简单方法,每次发生有趣的事件时,都会向日志写入一条消息。
I find the second reason for logging to be the most common. When an app is working perfectly, logs often go completely untouched. It’s when there’s a problem and a customer comes calling that logs become invaluable. A good set of logs can help you understand the conditions in your app that caused an error, including the context of the error itself, but also the context in previous requests.
我发现日志记录的第二个原因是最常见的。当应用程序完美运行时,日志通常完全保持不变。当出现问题并且客户打电话时,日志就会变得非常宝贵。一组好的日志可以帮助您了解应用中导致错误的条件,包括错误本身的上下文,以及之前请求中的上下文。
TIP Even with extensive logging in place, you may not realize you have a problem in your app unless you look through your logs regularly. For any medium-size to large app, this becomes impractical, so monitoring services such as Sentry (https://sentry.io) can be invaluable for notifying you of problems quickly.
提示:即使有大量的日志记录,除非您定期查看日志,否则您也可能不会意识到您的应用程序存在问题。对于任何大中型应用程序,这都变得不切实际,因此 Sentry (https://sentry.io) 等监控服务对于快速通知您问题非常宝贵。
If this sounds like a lot of work, you’re in luck. ASP.NET Core does a ton of the “breadcrumb logging” for you so that you can focus on creating high-quality log messages that provide the most value when diagnosing problems.
如果这听起来像是很多工作,那么您很幸运。ASP.NET Core 为您执行了大量的“痕迹导航日志记录”,以便您可以专注于创建高质量的日志消息,从而在诊断问题时提供最大价值。
26.1.1 Highlighting problems using custom log messages
26.1.1 使用自定义日志消息高亮显示问题
ASP.NET Core uses logging throughout its libraries. Depending on how you configure your app, you’ll have access to the details of each request and EF Core query, even without adding logging messages to your own code. In figure 26.1 you can see the log messages created when you view a single recipe in the recipe application.
ASP.NET Core 在其整个库中使用日志记录。根据你的应用配置方式,你将有权访问每个请求和 EF Core 查询的详细信息,即使不向你自己的代码添加日志记录消息也是如此。在图 26.1 中,您可以看到在配方应用程序中查看单个配方时创建的日志消息。
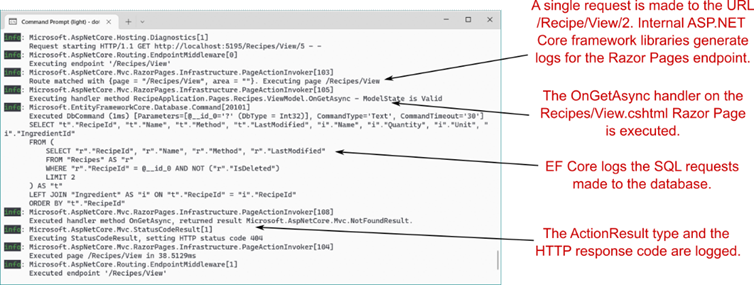
Figure 26.1 The ASP.NET Core Framework libraries use logging throughout. A single request generates multiple log messages that describe the flow of the request through your application.
图 26.1 ASP.NET Core Framework 库全程使用日志记录。单个请求会生成多条日志消息,用于描述请求通过应用程序的流向。
This gives you a lot of useful information. You can see which URL was requested, the Razor Page and page handler that were invoked (for a Razor Pages app), the Entity Framework Core (EF Core )database command, the action result executed, and the response. This information can be invaluable when you’re trying to isolate a problem, whether it’s a bug in a production app or a feature in development when you’re working locally.
这为您提供了很多有用的信息。您可以查看请求的 URL、调用的 Razor Page 和页面处理程序(针对 Razor Pages 应用)、Entity Framework Core (EF Core) 数据库命令、执行的作结果和响应。当您尝试隔离问题时,无论是生产应用程序中的错误还是本地工作时开发中的功能,这些信息都非常宝贵。
This infrastructure logging can be useful, but log messages that you create yourself can have even greater value. For example, you may be able to spot the cause of the error from the log messages in figure 26.1; we’re attempting to view a recipe with an unknown RecipeId of 5, but it’s far from obvious. If you explicitly add a log message to your app when this happens, as in figure 26.2, the problem is much more apparent.
此基础结构日志记录可能很有用,但您自己创建的日志消息可能具有更大的价值。例如,您可能能够从图 26.1 中的日志消息中发现错误的原因;我们正在尝试查看 RecipeId 未知为 5 的配方,但这远非显而易见。如果你在发生这种情况时显式地向你的应用程序添加一条日志消息,如图 26.2 所示,问题会更加明显。
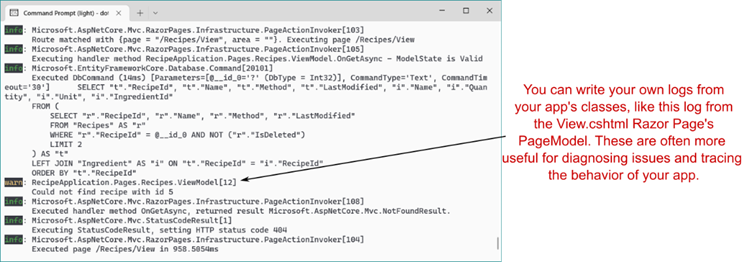
Figure 26.2 You can write your own logs. These are often more useful for identifying problems and interesting events in your apps.
图 26.2 您可以编写自己的日志。这些通常对于识别应用程序中的问题和有趣的事件更有用。
This custom log message easily stands out and clearly states both the problem (the recipe with the requested ID doesn’t exist) and the parameters/variables that led to it (the ID value of 5). Adding similar log messages to your own applications will make it easier for you to diagnose problems, track important events, and generally know what your app is doing.
此自定义日志消息很容易脱颖而出,并清楚地说明了问题(具有请求 ID 的配方不存在)和导致问题的参数/变量(ID 值为 5)。将类似的日志消息添加到您自己的应用程序将使您更容易诊断问题、跟踪重要事件,并且通常可以了解应用程序正在做什么。
I hope you’re now motivated to add logging to your apps, so we’ll dig into the details of what that involves. In section 26.1.2 you’ll see how to create a log message and how to define where the log messages are written. We’ll look in detail at these two aspects in sections 26.2 and 26.3; first, though, we’ll look at where they fit in terms of the ASP.NET Core logging framework as a whole.
我希望您现在有动力将日志记录添加到您的应用程序中,因此我们将深入研究其中涉及的细节。在 Section 26.1.2 中,您将看到如何创建日志消息以及如何定义日志消息的写入位置。我们将在 26.2 和 26.3 节中详细介绍这两个方面;不过,首先,我们将看看它们在整个 ASP.NET Core 日志记录框架中的位置。
26.1.2 The ASP.NET Core logging abstractions
26.1.2 ASP.NET Core 日志记录抽象
The ASP.NET Core logging framework consists of several abstractions (interfaces, implementations, and helper classes), the most important of which are shown in figure 26.3:
ASP.NET Core 日志记录框架由几个抽象(接口、实现和帮助程序类)组成,其中最重要的如图 26.3 所示:
• ILogger—This is the interface you’ll interact with in your code. It has a Log() method, which is used to write a log message.
ILogger - 这是您将在代码中与之交互的界面。它有一个 Log() 方法,用于编写日志消息。
• ILoggerProvider—This is used to create a custom instance of an ILogger, depending on the provider. A console ILoggerProvider would create an ILogger that writes to the console, whereas a file ILoggerProvider would create an ILogger that writes to a file.
ILoggerProvider - 用于创建 ILogger 的自定义实例,具体取决于提供程序。控制台 ILoggerProvider 将创建写入控制台的 ILogger,而文件 ILoggerProvider 将创建写入文件的 ILogger。
• ILoggerFactory—This is the glue between the ILoggerProvider instances and the ILogger you use in your code. You register ILoggerProvider instances with an ILoggerFactory and call CreateLogger() on the ILoggerFactory when you need an ILogger. The factory creates an ILogger that wraps each of the providers, so when you call the Log() method, the log is written to every provider.
ILoggerFactory - 这是 ILoggerProvider 实例和您在代码中使用的 ILogger 之间的粘附。使用 ILoggerFactory 注册 ILoggerProvider 实例,并在需要 ILogger 时对 ILoggerFactory 调用 CreateLogger () 。工厂会创建一个 ILogger 来包装每个提供程序,因此当您调用 Log() 方法时,日志将写入每个提供程序。
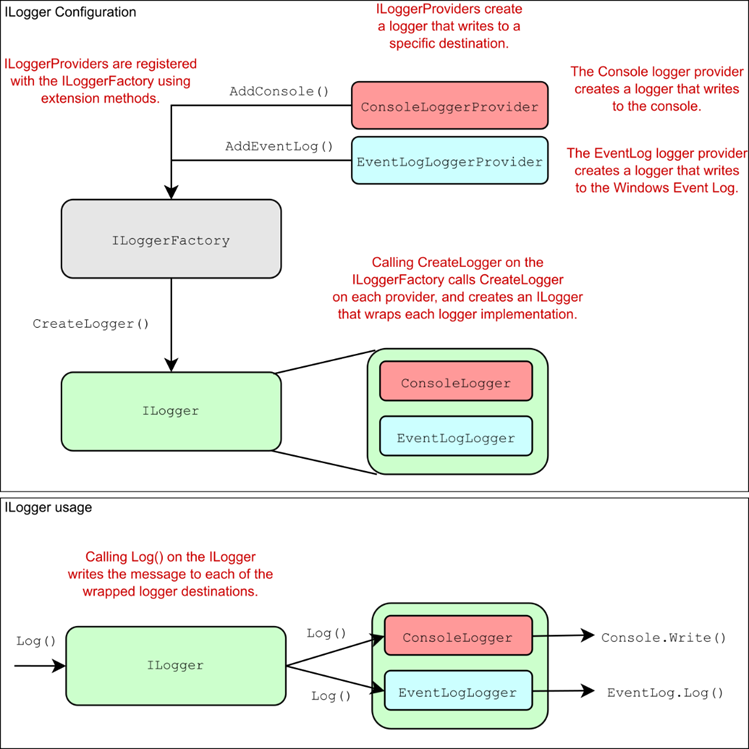
Figure 26.3 The components of the ASP.NET Core logging framework. You register logging providers with an ILoggerFactory, which creates implementations of ILogger. You write logs to the ILogger, which delegates to the ILogger implementations that write logs to the console or a file. You can send logs to multiple locations with this design without having to configure the locations when you create a log message.
图 26.3 ASP.NET Core 日志记录框架的组件。向 ILoggerFactory 注册日志记录提供程序,这将创建 ILogger 的实现。将日志写入 ILogger,ILogger 将委托给将日志写入控制台或文件的 ILogger 实现。您可以使用此设计将日志发送到多个位置,而无需在创建日志消息时配置位置。
The design in figure 26.3 makes it easy to add or change where your application writes the log messages without having to change your application code. The following listing shows all the code required to add an ILoggerProvider that writes logs to the console.
图 26.3 中的设计使添加或更改应用程序写入日志消息的位置变得容易,而无需更改应用程序代码。下面的清单显示了添加将日志写入控制台的 ILoggerProvider 所需的所有代码。
Listing 26.1 Adding a console log provider in Program.cs
清单 26.1 在 Program.cs 中添加控制台日志提供程序
WebApplicationBuilder builder = WebApplication.CreateBuilder(args);
builder.Logging.AddConsole() ❶

WebApplication app = builder.Build();

app.MapGet("/", () => "Hello World!");

app.Run();
❶ Adds a new provider using the Logging property on WebApplicationBuilder
使用 WebApplicationBuilder 上的 Logging 属性添加新的提供程序
NOTE The console logger is added by default by WebApplicationBuilder, as you’ll see in section 26.3.
注意:默认情况下,控制台 Logger 由 WebApplicationBuilder 添加,如第 26.3 节所示。
Other than this configuration on WebApplicationBuilder, you don’t interact with ILoggerProvider instances directly. Instead, you write logs using an instance of ILogger, as you’ll see in the next section.
除了 WebApplicationBuilder 上的此配置之外,您不直接与 ILoggerProvider 实例交互。相反,您可以使用 ILogger 的实例编写日志,如下一节所示。
26.2 Adding log messages to your application
26.2 向应用程序添加日志消息
In this section we’ll look in detail at how to create log messages in your own application. You’ll learn how to create an instance of ILogger, and how to use it to add logging to an existing application. Finally, we’ll look at the properties that make up a logging record, what they mean, and what you can use them for.
在本节中,我们将详细介绍如何在您自己的应用程序中创建日志消息。您将学习如何创建 ILogger 的实例,以及如何使用它来向现有应用程序添加日志记录。最后,我们将了解构成日志记录的属性、它们的含义以及您可以使用它们的用途。
Logging, like almost everything in ASP.NET Core, is available through DI. To add logging to your own services, you need only inject an instance of ILogger<T>, where T is the type of your service.
与 ASP.NET Core 中的几乎所有内容一样,日志记录可通过 DI 获得。要将日志记录添加到您自己的服务中,您只需注入ILogger<T>的实例,其中 T 是您的服务类型。
NOTE When you inject ILogger<T>, the DI container indirectly calls ILoggerFactory.CreateLoggerILogger<T> interface also implements the nongeneric ILogger interface but includes additional convenience methods.
注意当您注入 ILogger<T> 时,DI 容器会间接调用 ILoggerFactory.CreateLogger() 来创建图 26.3 中包装的 ILogger。在第 26.2.2 节中,如果您愿意,您将看到如何直接使用 ILoggerFactory。ILogger<T>接口还实现非泛型 ILogger 接口,但包含其他便捷方法。
You can use the injected ILogger instance to create log messages, which it writes to each configured ILoggerProvider. The following listing shows how to inject an ILogger<> instance into the PageModel of the Index.cshtml Razor Page for the recipe application from previous chapters and how to write a log message indicating how many recipes were found.
您可以使用注入的 ILogger 实例创建日志消息,并将其写入每个配置的 ILoggerProvider。以下列表显示了如何将 ILogger<> 实例注入前面章节中配方应用程序的 Index.cshtml Razor Page 的 PageModel,以及如何编写指示找到的配方数的日志消息。
Listing 26.2 Injecting ILogger into a class and writing a log message
清单 26.2 将 ILogger 注入到类中并编写日志消息
public class IndexModel : PageModel
{
    private readonly RecipeService _service;
    private readonly ILogger<IndexModel> _log;      #A

    public ICollection<RecipeSummaryViewModel> Recipes { get; set; }

    public IndexModel(
        RecipeService service,
        ILogger<IndexModel> log)                   #A
    {
        _service = service;
        _log = log;                                #A
    }

    public void OnGet()
    {
        Recipes = _service.GetRecipes();
        _log.LogInformation(                                  #B
            "Loaded {RecipeCount} recipes", Recipes.Count);   #B
    }
}
❶ Injects the generic ILogger
使用 DI 注入泛型 ILogger,它实现 ILogger
❷ Writes an Information-level log. The RecipeCount variable is substituted in the message.
写入信息级日志。RecipeCount 变量在消息中被替换。
In this example you’re using one of the many extension methods on ILogger to create the log message, LogInformation(). There are many extension methods on ILogger that let you easily specify a LogLevel for the message.
在此示例中,您将使用 ILogger 上的众多扩展方法之一来创建日志消息 LogInformation()。ILogger 上有许多扩展方法,可让您轻松指定消息的 LogLevel。
DEFINITION The log level of a log is how important it is and is defined by the LogLevel enum. Every log message has a log level.
定义:日志的日志级别是它的重要性,由 LogLevel 枚举定义。每条日志消息都有一个日志级别。
You can also see that the message you pass to the LogInformation method has a placeholder indicated by braces, {RecipeCount}, and you pass an additional parameter, Recipes.Count, to the logger. The logger replaces the placeholder with the parameter at runtime. Placeholders are matched with parameters by position, so if you include two placeholders, for example, the second placeholder is matched with the second parameter.
您还可以看到,传递给 LogInformation 方法的消息具有由大括号指示的占位符 {RecipeCount},并且您将附加参数 Recipes.Count 传递给记录器。记录器在运行时将占位符替换为参数。占位符按位置与参数匹配,因此,例如,如果您包括两个占位符,则第二个占位符将与第二个参数匹配。
TIP You could have used normal string interpolation to create the log message, as in $"Loaded {Recipes.Count} recipes". But I recommend always using placeholders, as they provide additional information for the logger that can be used for structured logging, as you’ll see in section 26.5.
提示:您可以使用普通字符串插值来创建日志消息,如 $“Loaded {Recipes.Count} recipes”。但是我建议始终使用占位符,因为它们为 Logger 提供了可用于结构化日志记录的附加信息,如您将在Section 26.5中看到的那样。
When the OnGet page handler in the IndexModel executes, ILogger writes a message to any configured logging providers. The exact format of the log message varies from provider to provider, but figure 26.4 shows how the console provider displays the log message from listing 26.2.
当 IndexModel 中的 OnGet 页面处理程序执行时, ILogger 会将消息写入任何已配置的日志记录提供程序。日志消息的确切格式因提供者而异,但图 26.4 显示了控制台提供者如何显示清单 26.2 中的日志消息。
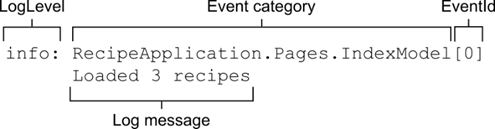
Figure 26.4 An example log message as it’s written to the default console provider. The log-level category provides information about how important the message is and where it was generated. The EventId provides a way to identify similar log messages.
图 26.4 写入默认控制台提供程序时的日志消息示例。日志级别类别提供有关消息的重要性以及消息生成位置的信息。EventId 提供了一种识别类似日志消息的方法。
The exact presentation of the message will vary depending on where the log is written, but each log record includes up to six common elements:
消息的确切表示方式会因日志的写入位置而异,但每条日志记录最多包含六个常见元素:
• Log level—The log level of the log is how important it is and is defined by the LogLevel enum.
日志级别 - 日志的日志级别是它的重要性,由 LogLevel 枚举定义。
• Event category—The category may be any string value, but it’s typically set to the name of the class creating the log. For ILogger<T>, the full name of the type T is the category.
事件类别 - 类别可以是任何字符串值,但通常设置为创建日志的类的名称。对于ILogger<T>,类型 T 的全名是类别。
• Message—This is the content of the log message. It can be a static string, or it can contain placeholders for variables, as shown in listing 26.2. Placeholders are indicated by braces, {} and are replaced by the provided parameter values.
Message - 这是日志消息的内容。它可以是一个静态字符串,也可以包含变量的占位符,如清单 26.2 所示。占位符由大括号 {} 表示,并替换为提供的参数值。
• Parameters—If the message contains placeholders, they’re associated with the provided parameters. For the example in listing 26.2, the value of Recipes.Count is assigned to the placeholder called RecipeCount. Some loggers can extract these values and expose them in your logs, as you’ll see in section 26.5.
参数 - 如果消息包含占位符,则它们与提供的参数相关联。对于清单 26.2 中的示例,Recipes.Count 的值被分配给名为 RecipeCount 的占位符。一些 Logger 可以提取这些值并在您的日志中公开它们,正如您将在Section 26.5中看到的那样。
• Exception—If an exception occurs, you can pass the exception object to the logging function along with the message and other parameters. The logger records the exception in addition to the message itself.
Exception - 如果发生异常,可以将 exception 对象与消息和其他参数一起传递给日志记录函数。除了消息本身之外,Logger 还会记录异常。
• EventId—This is an optional integer identifier for the error, which can be used to quickly find all similar logs in a series of log messages. You might use an EventId of 1000 when a user attempts to load a non-existent recipe and an EventId of 1001 when a user attempts to access a recipe they don’t have permission to access. If you don’t provide an EventId, the value 0 is used.
EventId - 这是错误的可选整数标识符,可用于在一系列日志消息中快速查找所有相似日志。当用户尝试加载不存在的配方时,您可以使用 EventId 1000,当用户尝试访问他们无权访问的配方时,您可以使用 EventId 1001。如果您未提供 EventId,则使用值 0。
High-performance logging with source generators
使用源生成器进行高性能日志记录源Source generators are a compiler feature introduced in C# 9. Using this feature, you can automatically generate boilerplate code when your project compiles. .NET 7 includes several built-in source generators, such as the Regex generator I described in chapter 14. There’s also a source generator that works with ILogger, which can help you avoid pitfalls such as accidentally using interpolated strings, and makes more advanced and performant logging patterns easy to use.
生成器是 C# 9 中引入的一项编译器功能。使用此功能,您可以在项目编译时自动生成样板代码。.NET 7 包括几个内置的源生成器,例如我在第 14 章中描述的 Regex 生成器。还有一个与 ILogger 配合使用的源生成器,它可以帮助您避免误区,例如意外使用内插字符串,并使更高级和高性能的日志记录模式易于使用。To use the logging source generator in the OnGet handler from listing 26.2, define a partial method in the IndexModel class, decorate it with a [LoggerMessage] attribute, and invoke the method inside the OnGet handler method:
要在清单 26.2 中的 OnGet 处理程序中使用日志记录源生成器,请在 IndexModel 类中定义一个分部方法,用 [LoggerMessage] 属性修饰它,并在 OnGet 处理程序方法中调用该方法:
[LoggerMessage(10, LogLevel.Information, "Loaded {RecipeCount} recipes")]
partial void LogLoadedRecipes(int recipeCount);

public void OnGet()
{
Recipes = _service.GetRecipes();
LogLoadedRecipes(Recipes.Count);
}
The [LoggerMessage] attribute defines the event ID, log level, and message the log message uses, and the parameters of the partial method it decorates are substituted into the message at runtime. This pattern also comes with several analyzers to make sure you use it correctly in your code while optimizing the generated code behind the scenes to prevent allocations where possible.
该 [LoggerMessage] 属性定义日志消息使用的事件 ID、日志级别和消息,并且它修饰的分部方法的参数在运行时替换为消息。此模式还附带了多个分析器,以确保您在代码中正确使用它,同时在后台优化生成的代码,以尽可能防止分配。The logging source generator is optional, so it’s up to you whether to use it. You can read more about the source generator, the extra configuration options, and how it works on my blog at http://mng.bz/vn14 and in the documentation at http://mng.bz/4D1j.
日志记录源生成器是可选的,因此是否使用它取决于您。您可以在我的博客 http://mng.bz/vn14 和文档 http://mng.bz/4D1j 中阅读有关源生成器、额外配置选项及其工作原理的更多信息。
Not every log message will have all the possible elements. You won’t always have an Exception or parameters, for example, and it’s common to omit the EventId. There are various overloads to the logging methods that take these elements as additional method parameters. Besides these optional elements, each message has, at very least, a level, category, and message. These are the key features of the log, so we’ll look at each in turn.
并非每条日志消息都包含所有可能的元素。例如,您不会总是有 Exception 或参数,省略 EventId 是很常见的。日志记录方法存在各种重载,这些重载将这些元素作为附加方法参数。除了这些可选元素之外,每条消息至少具有 level、category 和 message。这些是日志的主要功能,因此我们将依次查看每个功能。
26.2.1 Log level: How important is the log message?
26.2.1 日志级别:日志消息有多重要?
Whenever you create a log using ILogger, you must specify the log level. This indicates how serious or important the log message is, and it’s an important factor when it comes to filtering which logs are written by a provider, as well as finding the important log messages after the fact.
每当使用 ILogger 创建日志时,都必须指定日志级别。这表明日志消息的严重性或重要性,在筛选提供商写入的日志以及事后查找重要日志消息时,这是一个重要因素。
You might create an Information level log when a user starts to edit a recipe. This is useful for tracing the application’s flow and behavior, but it’s not important, because everything is normal. But if an exception is thrown when the user attempts to save the recipe, you might create a Warning or Error level log.
当用户开始编辑配方时,您可以创建 Information level log(信息级别日志)。这对于跟踪应用程序的流和行为很有用,但并不重要,因为一切都很正常。但是,如果在用户尝试保存配方时引发异常,则可以创建 Warning (警告) 或 Error (错误) 级别日志。
The log level is typically set by using one of several extension methods on the ILogger interface, as shown in listing 26.3. This example creates an Information level log when the View method executes and a Warning level error if the requested recipe isn’t found.
日志级别通常是通过使用 ILogger 接口上的几种扩展方法之一来设置的,如清单 26.3 所示。此示例在执行 View 方法时创建 Information 级别日志,如果未找到请求的配方,则创建 Warning 级别错误。
Listing 26.3 Specifying the log level using extension methods on ILogger
清单 26.3 在 ILogger 上使用扩展方法指定日志级别
private readonly ILogger _log;          #A
public async IActionResult OnGet(int id)
{
    _log.LogInformation(                            #B
        "Loading recipe with id {RecipeId}", id);   #B

    Recipe = _service.GetRecipeDetail(id);
    if (Recipe is null)
    {
        _log.LogWarning(                                      #C
            "Could not find recipe with id {RecipeId}", id);  #C
        return NotFound();
    }
    return Page();
}
❶ An ILogger instance is injected into the Razor Page using constructor injection.
使用构造函数注入将 ILogger 实例注入 Razor 页面。
❷ Writes an Information level log message
写入信息级别日志消息
❸ Writes a Warning level log message
写入警告级别日志消息
The LogInformation and LogWarning extension methods create log messages with a log level of Information and Warning, respectively. There are six log levels to choose among, ordered here from most to least serious:
LogInformation 和 LogWarning 扩展方法分别创建日志级别为 Information 和 Warning 的日志消息。有六个日志级别可供选择,此处按从最严重到最不严重的顺序排序:
• Critical—For disastrous failures that may leave the app unable to function correctly, such as out-of-memory exceptions or if the hard drive is out of disk space or the server is on fire.
严重 - 对于可能导致应用程序无法正常工作的灾难性故障,例如内存不足异常、硬盘驱动器磁盘空间不足或服务器着火。
• Error—For errors and exceptions that you can’t handle gracefully, such as exceptions thrown when saving an edited entity in EF Core. The operation failed, but the app can continue to function for other requests and users.
错误 - 对于无法正常处理的错误和异常,例如在 EF Core 中保存已编辑的实体时引发的异常。作失败,但应用程序可以继续为其他请求和用户运行。
• Warning—For when an unexpected or error condition arises that you can work around. You might log a Warning for handled exceptions or when an entity isn’t found, as in listing 26.3.
“警告”(Warning) - 当出现可解决的意外或错误情况时。对于已处理的异常或未找到实体,您可以记录 Warning,如清单 26.3 所示。
• Information—For tracking normal application flow, such as logging when a user signs in or when they view a specific page in your app. Typically these log messages provide context when you need to understand the steps leading up to an error message.
信息 - 用于跟踪正常的应用程序流,例如在用户登录或查看应用程序中的特定页面时进行日志记录。通常,当您需要了解导致错误消息的步骤时,这些日志消息会提供上下文。
• Debug—For tracking detailed information that’s particularly useful during development. Generally, this level has only short-term usefulness.
调试 (Debug) - 用于跟踪开发过程中特别有用的详细信息。一般来说,这个级别只有短期的用处。
• Trace—For tracking extremely detailed information, which may contain sensitive information like passwords or keys. It’s rarely used and not used at all by the framework libraries.
跟踪 - 用于跟踪极其详细的信息,其中可能包含密码或密钥等敏感信息。它很少被框架库使用,也根本不被使用。
Think of these log levels in terms of a pyramid, as shown in figure 26.5. As you progress down the log levels, the importance of the messages goes down, but the frequency goes up. Typically, you’ll find many Debug level log messages in your application, but (I hope) few Critical- or Error-level messages.
将这些对数级别想象成金字塔,如图 26.5 所示。随着日志级别的降低,消息的重要性会下降,但频率会上升。通常,您会在应用程序中找到许多 Debug 级别的日志消息,但 (我希望) 很少的 Critical- 或 Error 级别的消息。
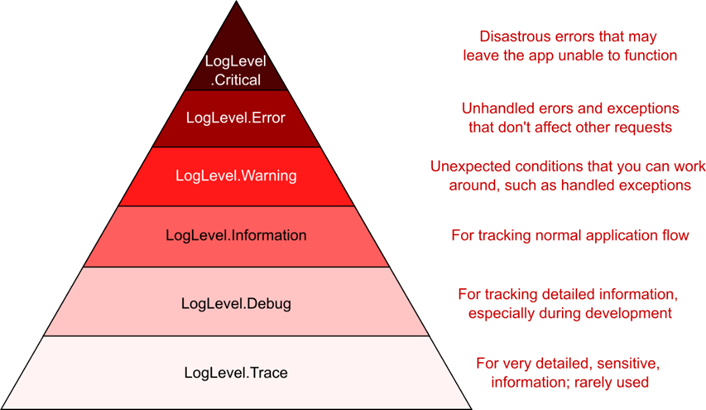
Figure 26.5 The pyramid of log levels. Logs with a level near the base of the pyramid are used more frequently but are less important. Logs with a level near the top should be rare but are important.
图 26.5 对数水平的金字塔。水平仪靠近金字塔底部的原木使用频率更高,但不太重要。级别接近顶部的日志应该很少见,但很重要。
This pyramid shape will become more meaningful when we look at filtering in section 26.4. When an app is in production, you typically don’t want to record all the Debug-level messages generated by your application. The sheer volume of messages would be overwhelming to sort through and could end up filling your disk with messages that say “Everything’s OK!” Additionally, Trace messages shouldn’t be enabled in production, as they may leak sensitive data. By filtering out the lower log levels, you can ensure that you generate a sane number of logs in production but have access to all the log levels in development.
当我们查看 26.4 节中的过滤时,这个金字塔形状将变得更加有意义。当应用程序处于生产环境中时,您通常不希望记录应用程序生成的所有 Debug 级别消息。庞大的消息量会让人不知所措,最终可能会用“一切都很好”的消息填满您的磁盘。此外,不应在生产环境中启用 Trace 消息,因为它们可能会泄露敏感数据。通过筛选出较低的日志级别,您可以确保在生产环境中生成一定数量的日志,但可以访问开发中的所有日志级别。
In general, higher-level logs are more important than lower-level logs, so a Warning log is more important than an Information log, but there’s another aspect to consider. Where the log came from, or who created the log, is a key piece of information that’s recorded with each log message and is called the category.
通常,较高级别的日志比较低级别的日志更重要,因此 Warning 日志比 Information 日志更重要,但还有另一个方面需要考虑。日志的来源或日志的创建者是每条日志消息中记录的关键信息,称为类别。
26.2.2 Log category: Which component created the log
26.2.2 日志类别:哪个组件创建了日志
As well as a log level, every log message also has a category. You set the log level independently for every log message, but the category is set when you create the ILogger instance. Like log levels, the category is particularly useful for filtering, as you’ll see in section 26.4. It’s written to every log message, as shown in figure 26.6.
除了日志级别外,每条日志消息也有一个类别。您可以为每个日志消息单独设置日志级别,但类别是在创建 ILogger 实例时设置的。与日志级别一样,该类别对于过滤特别有用,如第 26.4 节所示。它被写入每个日志消息,如图 26.6 所示。
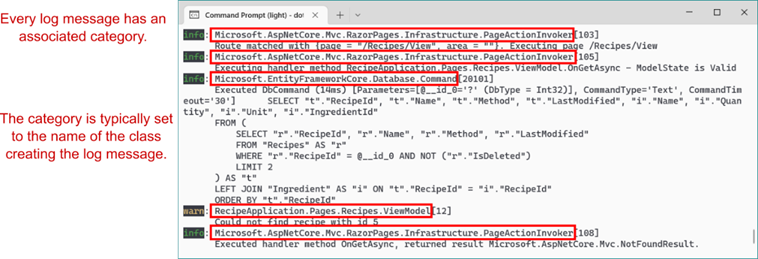
Figure 26.6 Every log message has an associated category, which is typically the class name of the component creating the log. The default console logging provider outputs the log category for every log.
图 26.6 每条日志消息都有一个关联的类别,通常是创建日志的组件的类名。默认控制台日志记录提供程序输出每个日志的日志类别。
The category is a string, so you can set it to anything, but the convention is to set it to the fully qualified name of the type that’s using ILogger. In section 26.2 I achieved this by injecting ILogger
category 是一个字符串,因此您可以将其设置为任何值,但惯例是将其设置为使用 ILogger 的类型的完全限定名称。在第 26.2 节中,我通过将 ILogger 注入 RecipeController 来实现这一点;泛型参数 T 用于设置 ILogger 的类别。
Alternatively, you can inject ILoggerFactory into your methods and pass an explicit category when creating an ILogger instance, as shown in the following listing. This lets you change the category to an arbitrary string.
或者,可以将 ILoggerFactory 注入到方法中,并在创建 ILogger 实例时传递显式类别,如下面的清单所示。这允许您将类别更改为任意字符串。
Listing 26.4 Injecting ILoggerFactory to use a custom category
列表 26.4 注入 ILoggerFactory 以使用自定义类别
public class RecipeService
{
    private readonly ILogger _log;
    public RecipeService(ILoggerFactory factory)    #A
    {
        _log = factory.CreateLogger("RecipeApp.RecipeService");     #B
    }
}
❶ Injects an ILoggerFactory instead of an ILogger directly
直接注入 ILoggerFactory 而不是 ILogger
❷ Passes a category as a string when calling CreateLogger
调用 CreateLogger 时将类别作为字符串传递
There is also an overload of CreateLogger() with a generic parameter that uses the provided class to set the category. If the RecipeService in listing 26.4 were in the RecipeApp namespace, the CreateLogger call could be written equivalently as
还有一个 CreateLogger() 的重载,其中包含一个泛型参数,该参数使用提供的类来设置类别。如果清单 26.4 中的 RecipeService 位于 RecipeApp 命名空间中,则 CreateLogger 调用可以等效地写为
_log = factory.CreateLogger<RecipeService>();Similarly, the final ILogger instance created by this call would be the same as if you’d directly injected ILogger<RecipeService> instead of ILoggerFactory.
同样,此调用创建的最终 ILogger 实例与直接注入 ILogger<RecipeService> 而不是 ILoggerFactory 时相同。
TIP Unless you’re using heavily customized categories for some reason, favor injecting ILogger<T> into your methods over ILoggerFactory.
提示:除非出于某种原因使用高度自定义的类别,否则最好将 ILogger<T> 注入到方法中,而不是 ILoggerFactory。
The final compulsory part of every log entry is fairly obvious: the log message. At the simplest level, this can be any string, but it’s worth thinking carefully about what information would be useful to record—anything that will help you diagnose problems later on.
每个日志条目的最后一个强制部分相当明显:日志消息。在最简单的级别上,这可以是任何字符串,但值得仔细考虑记录哪些信息是有用的 — 任何有助于您稍后诊断问题的信息。
26.2.3 Formatting messages and capturing parameter values
26.2.3 格式化消息和捕获参数值
Whenever you create a log entry, you must provide a message. This can be any string you like, but as you saw in listing 26.2, you can also include placeholders indicated by braces, {}, in the message string:
无论何时创建日志条目,都必须提供一条消息。这可以是你喜欢的任何字符串,但正如你在 清单 26.2 中看到的,你也可以在消息字符串中包含由大括号 {} 指示的占位符:
_log.LogInformation("Loaded {RecipeCount} recipes", Recipes.Count);Including a placeholder and a parameter value in your log message effectively creates a key-value pair, which some logging providers can store as additional information associated with the log. The previous log message would assign the value of Recipes.Count to a key, RecipeCount, and the log message itself is generated by replacing the placeholder with the parameter value, to give the following (where Recipes.Count=3):
在日志消息中包含占位符和参数值可以有效地创建一个键值对,一些日志记录提供商可以将其存储为与日志关联的其他信息。前面的日志消息会将 Recipes.Count 的值分配给键 RecipeCount,并且日志消息本身是通过将占位符替换为参数值来生成的,以给出以下内容(其中 Recipes.Count=3):
"Loaded 3 recipes"You can include multiple placeholders in a log message, and they’re associated with the additional parameters passed to the log method. The order of the placeholders in the format string must match the order of the parameters you provide.
您可以在日志消息中包含多个占位符,它们与传递给 log 方法的其他参数相关联。格式字符串中占位符的顺序必须与您提供的参数的顺序匹配。
WARNING You must pass at least as many parameters to the log method as there are placeholders in the message. If you don’t pass enough parameters, you’ll get an exception at runtime.
警告:向 log 方法传递的参数必须至少与消息中的占位符数量相同。如果您没有传递足够的参数,您将在运行时收到异常。
For example, the log message
例如,日志消息
_log.LogInformation("User {UserId} loaded recipe {RecipeId}", 123, 456)would create the parameters UserId=123 and RecipeId=456. Structured logging providers could store these values, in addition to the formatted log message "User 123 loaded recipe 456". This makes it easier to search the logs for a particular UserId or RecipeId.
将创建参数 UserId=123 和 RecipeId=456。结构化日志记录提供程序可以存储这些值,以及格式化的日志消息“User 123 loaded recipe 456”。这样可以更轻松地在日志中搜索特定 UserId 或 RecipeId。
DEFINITION Structured or semantic logging attaches additional structure to log messages to make them more easily searchable and filterable. Rather than storing only text, it stores additional contextual information, typically as key-value pairs. JavaScript Object Notation (JSON) is a common format used for structured log messages.
定义:结构化或语义日志记录将其他结构附加到日志消息,使其更易于搜索和筛选。它不仅存储文本,还存储其他上下文信息,通常作为键值对。JavaScript 对象表示法 (JSON) 是用于结构化日志消息的常用格式。
Not all logging providers use semantic logging. The default console logging provider format doesn’t, for example; the message is formatted to replace the placeholders, but there’s no way of searching the console by key-value.
并非所有日志记录提供程序都使用语义日志记录。例如,默认的控制台日志记录提供程序格式不会;消息的格式设置为替换占位符,但无法按 Key-Value 搜索控制台。
TIP You can enable JSON output for the console provider by calling WebApplicationBuilder.Logging.AddJsonConsole(). You can further customize the format of the provider, as described in the documentation at http://mng.bz/QP8v.
提示:您可以通过调用 WebApplicationBuilder.Logging.AddJsonConsole() 为控制台提供程序启用 JSON 输出。您可以进一步自定义提供程序的格式,如 http://mng.bz/QP8v 中的文档中所述。
Even if you’re not using structured logging initially, I recommend writing your log messages as though you are, with explicit placeholders and parameters. That way, if you decide to add a structured logging provider later, you’ll immediately see the benefits. Additionally, I find that thinking about the parameters that you can log in this way prompts you to record more parameter values instead of only a log message. There’s nothing more frustrating than seeing a message like "Cannot insert record due to duplicate key" but not having the key value logged!
即使您最初没有使用结构化日志记录,我也建议您像使用结构化日志记录一样编写日志消息,并使用明确的占位符和参数。这样,如果您决定稍后添加结构化日志记录提供商,您将立即看到好处。此外,我发现,考虑可以以这种方式记录的参数会提示您记录更多参数值,而不仅仅是日志消息。没有什么比看到类似 “Cannot insert record due to duplicate key” 的消息但没有记录键值更令人沮丧的了!
TIP Generally speaking, I’m a fan of C#’s interpolated strings, but don’t use them for your log messages when a placeholder and parameter would also make sense. Using placeholders instead of interpolated strings gives you the same output message but also creates key-value pairs that can be searched later.
提示:一般来说,我是 C# 的插值字符串的粉丝,但当占位符和参数也有意义时,不要将它们用于日志消息。使用占位符而不是内插字符串会为您提供相同的输出消息,但也会创建稍后可搜索的键值对。
We’ve looked a lot at how you can create log messages in your app, but we haven’t focused on where those logs are written. In the next section we’ll look at the built-in ASP.NET Core logging providers, how they’re configured, and how you can add a third-party provider.
我们已经研究了很多关于如何在应用程序中创建日志消息的研究,但我们没有关注这些日志的写入位置。在下一节中,我们将了解内置的 ASP.NET Core 日志记录提供程序、它们的配置方式以及如何添加第三方提供程序。
26.3 Controlling where logs are written using logging providers
26.3 使用日志记录提供程序控制日志的写入位置
In this section you’ll learn how to control where your log messages are written by adding ILoggerProviders to your application. As an example, you’ll see how to add a simple file logger provider that writes your log messages to a file, in addition to the existing console logger provider.
在本节中,您将了解如何通过将 ILoggerProviders 添加到您的应用程序来控制日志消息的写入位置。例如,除了现有的控制台记录器提供程序之外,您还将了解如何添加一个简单的文件记录器提供程序,用于将日志消息写入文件。
Up to this point, we’ve been writing all our log messages to the console. If you’ve run any ASP.NET Core sample apps locally, you’ll probably have seen the log messages written to the console window.
到目前为止,我们一直在将所有日志消息写入控制台。如果您在本地运行了任何 ASP.NET Core 示例应用程序,则可能已经看到写入控制台窗口的日志消息。
NOTE If you’re using Visual Studio and debugging by using the Internet Information Services (IIS) Express option, you won’t see the console window (though the log messages are written to the Debug Output window instead).
注意:如果您使用的是 Visual Studio 并使用 Internet Information Services (IIS) Express 选项进行调试,则不会看到控制台窗口(尽管日志消息会写入“调试输出”窗口)。
Writing log messages to the console is great when you’re debugging, but it’s not much use for production. No one’s going to be monitoring a console window on a server, and the logs wouldn’t be saved anywhere or be searchable. Clearly, you’ll need to write your production logs somewhere else.
在调试时,将日志消息写入控制台非常有用,但对生产没有多大用处。没有人会监控服务器上的控制台窗口,日志不会保存在任何地方,也无法搜索。显然,您需要将生产日志写入其他位置。
As you saw in section 26.1, logging providers control the destination of your log messages in ASP.NET Core. They take the messages you create using the ILogger interface and write them to an output location, which varies depending on the provider.
正如您在第 26.1 节中看到的那样,日志记录提供程序控制 ASP.NET Core 中日志消息的目的地。它们获取您使用 ILogger 接口创建的消息,并将其写入输出位置,该位置因提供商而异。
NOTE This name always gets to me: the log provider effectively consumes the log messages you create and outputs them to a destination. You can probably see the origin of the name from figure 26.3, but I still find it somewhat counterintuitive.
注意:我总是能想到这个名字:日志提供程序会有效地使用您创建的日志消息,并将它们输出到目标。你可能可以从图 26.3 中看到这个名字的由来,但我仍然觉得它有点违反直觉。
Microsoft has written several first-party log providers for ASP.NET Core that are available out of the box in ASP.NET Core. These providers include
Microsoft 为 ASP.NET Core 编写了几个第一方日志提供程序,这些提供程序在 ASP.NET Core 中开箱即用。这些提供商包括
• Console provider—Writes messages to the console, as you’ve already seen
控制台提供程序 - 如您所见,将消息写入控制台
• Debug provider—Writes messages to the debug window when you’re debugging an app in Visual Studio or Visual Studio Code, for example
调试提供程序 - 例如,当您在 Visual Studio 或 Visual Studio Code 中调试应用程序时,将消息写入调试窗口
• EventLog provider—Writes messages to the Windows Event Log and outputs log messages only when running in Windows, as it requires Windows-specific APIs
EventLog 提供程序 - 仅在 Windows 中运行时将消息写入 Windows 事件日志并输出日志消息,因为它需要特定于 Windows 的 API
• EventSource provider—Writes messages using Event Tracing for Windows (ETW) or LTTng tracing on Linux
EventSource 提供程序 - 使用 Windows 事件跟踪 (ETW) 或 Linux 上的 LTTng 跟踪编写消息
There are also many third-party logging provider implementations, such as an Azure App Service provider, an elmah.io provider, and an Elasticsearch provider. On top of that, there are integrations with other existing logging frameworks like NLog and Serilog. It’s always worth looking to see whether your favorite .NET logging library or service has a provider for ASP.NET Core, as most do.
还有许多第三方日志记录提供程序实现,例如 Azure 应用服务提供商、elmah.io 提供程序和 Elasticsearch 提供程序。最重要的是,它还与其他现有的日志记录框架(如 NLog 和 Serilog)集成。看看您最喜欢的 .NET 日志记录库或服务是否像大多数一样具有 ASP.NET Core 的提供程序,始终值得一试。
TIP Serilog (https://serilog.net) is my go-to logging framework. It’s a mature framework with a huge number of supported destinations for writing logs. See Serilog’s ASP.NET Core integration repository for details on how to use Serilog with ASP.NET Core apps: https://github.com/serilog/serilog-aspnetcore.
提示:Serilog (https://serilog.net) 是我的首选日志记录框架。它是一个成熟的框架,具有大量支持写入日志的目标。有关如何将 Serilog 与 ASP.NET Core 应用程序结合使用的详细信息,请参阅 Serilog 的 ASP.NET Core 集成存储库:https://github.com/serilog/serilog-aspnetcore。
You configure the logging providers for your app in Program.cs. WebApplicationBuilder configures the console and debug providers for your application automatically, but it’s likely that you’ll want to change or add to these.
您可以在 Program.cs 中为您的应用程序配置日志记录提供程序。WebApplicationBuilder 会自动为您的应用程序配置控制台和调试提供程序,但您可能希望更改或添加这些提供程序。
In this section I show how to add a simple third-party logging provider that writes to a rolling file so our application writes logs to a new file each day. We’ll continue to log using the console and debug providers as well, because they’re more useful than the file provider when developing locally.
在本节中,我将介绍如何添加一个简单的第三方日志记录提供程序,该提供程序将写入滚动文件,以便我们的应用程序每天将日志写入新文件。我们还将继续使用控制台和调试提供程序进行日志记录,因为在本地开发时,它们比文件提供程序更有用。
To add a third-party logging provider in ASP.NET Core, follow these steps:
要在 ASP.NET Core 中添加第三方日志记录提供程序,请执行以下步骤:
- Add the logging provider NuGet package to the solution. I’m going to be using a provider called NetEscapades.Extensions.Logging.RollingFile, which is available on NuGet and GitHub. You can add it to your solution using the NuGet Package Manager in Visual Studio or using the .NET command-line interface (CLI) by running
将日志记录提供程序 NuGet 包添加到解决方案中。我将使用一个名为 NetEscapades.Extensions.Logging.RollingFile 的提供程序,该提供程序可在 NuGet 和 GitHub 上找到。您可以使用 Visual Studio 中的 NuGet 包管理器或使用 .NET 命令行界面 (CLI) 将其添加到解决方案中,方法是运行
dotnet add package NetEscapades.Extensions.Logging.RollingFilefrom your application’s project folder.
从应用程序的 Project 文件夹中。
- Add the logging provider to WebApplicationBuilder.Logging. You can add the file provider by calling AddFile(), as shown in the next listing. AddFile() is an extension method provided by the logging provider package to simplify adding the provider to your app.
将日志记录提供程序添加到 WebApplicationBuilder.Logging。您可以通过调用 AddFile() 来添加文件提供程序,如下一个清单所示。AddFile() 是日志记录提供程序包提供的扩展方法,用于简化向应用程序添加提供程序的过程。
NOTE This package is a simple file logging provider, available at http://mng.bz/XN5a. It’s based on the Azure App Service logging provider. If you need a more robust package, consider using Serilog’s file providers instead.
注意:此包是一个简单的文件日志记录提供程序,可从 http://mng.bz/XN5a 获取。它基于 Azure 应用服务日志记录提供程序。如果您需要更健壮的包,请考虑改用 Serilog 的文件提供程序。
Listing 26.5 Adding a third-party logging provider to WebApplicationBuilder
清单 26.5 向 WebApplicationBuilder 添加第三方日志提供程序
WebApplicationBuilder builder = WebApplication.CreateBuilder(args); ❶
builder.Logging.AddFile(); ❷

WebApplication app = builder.Build();

app.MapGet("/", () => "Hello world!");

app.Run();
❶ The WebApplicationBuilder configures the console and debug providers as normal.
WebApplicationBuilder 照常配置控制台和调试提供程序。
❷ Adds the new file logging provider to the logger factory
将新的文件日志记录提供程序添加到 Logger 工厂
NOTE Adding a new provider doesn’t replace existing providers. WebApplicationBuilder automatically adds the console and debug logging providers in listing 26.5. To remove them, call builder.Logging.ClearProviders() before adding the file provider.
注意:添加新的提供商不会替换现有的提供商。WebApplicationBuilder 在清单 26.5 中自动添加控制台和调试日志提供程序。要删除它们,请调用 builder。Logging.ClearProviders() 的调用。
With the file logging provider configured, you can run the application and generate logs. Every time your application writes a log using an ILogger instance, ILogger writes the message to all configured providers, as shown in figure 26.7. The console messages are conveniently available, but you also have a persistent record of the logs stored in a file.
配置文件日志记录提供程序后,您可以运行应用程序并生成日志。每次您的应用程序使用 ILogger 实例写入日志时,ILogger 都会将消息写入所有配置的提供程序,如图 26.7 所示。控制台消息非常方便,但您也有存储在文件中的日志的持久记录。
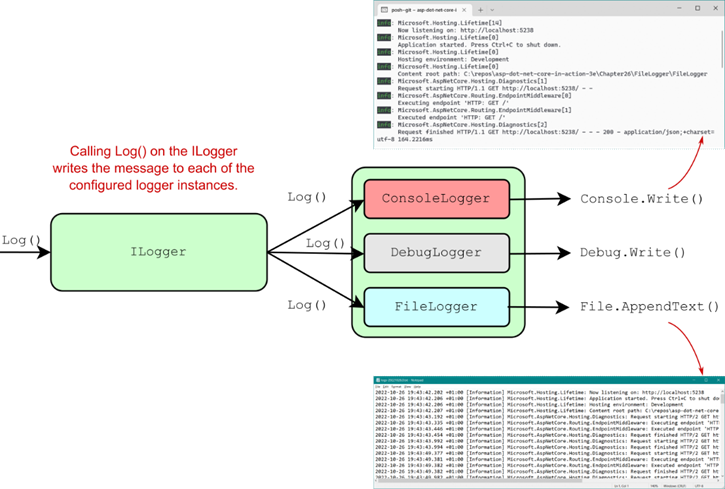
Figure 26.7 Logging a message with ILogger writes the log using all the configured providers. This lets you, for example, log a convenient message to the console while also persisting the logs to a file.
图 26.7 使用 ILogger 记录消息会使用所有配置的提供程序写入日志。例如,这样,您就可以将方便的消息记录到控制台,同时将日志保存到文件中。
TIP By default, the rolling file provider writes logs to a subdirectory of your application. You can specify additional options such as filenames and file size limits using overloads of AddFile(). For production, I recommend using a more established logging provider, such as Serilog.
提示:默认情况下,滚动文件提供程序将日志写入应用程序的子目录。您可以使用 AddFile() 的重载指定其他选项,例如文件名和文件大小限制。对于生产环境,我建议使用更成熟的日志记录提供程序,例如 Serilog。
The key takeaway from listing 26.5 is that the provider system makes it easy to integrate existing logging frameworks and providers with the ASP.NET Core logging abstractions. Whichever logging provider you choose to use in your application, the principles are the same: add a new logging provider to WebApplicationBuilder.Logging using extension methods like AddConsole(), or AddFile() in this case.
清单 26.5 的关键要点是,provider 系统可以轻松地将现有的日志框架和提供程序与 ASP.NET Core 日志抽象集成。无论您选择在应用程序中使用哪种日志记录提供程序,原则都是相同的:使用AddConsole()或AddFile()等扩展方法向WebApplicationBuilder.Logging添加新的日志记录提供程序。
Logging your application messages to a file can be useful in some scenarios, and it’s certainly better than logging to a nonexistent console window in production, but it may still not be the best option.
在某些情况下,将应用程序消息记录到文件中可能很有用,这肯定比在生产环境中记录到不存在的控制台窗口要好,但它可能仍然不是最佳选择。
If you discovered a bug in production and needed to look at the logs quickly to see what happened, for example, you’d need to log on to the remote server, find the log files on disk, and trawl through them to find the problem. If you have multiple web servers, you’d have a mammoth job to fetch all the logs before you could even start to tackle the bug—assuming that you even have remote access to the production servers! Not fun. Add to that the possibility of file permission or drive space problems, and file logging seems less attractive.
例如,如果您在生产中发现了一个错误,并且需要快速查看日志以了解发生了什么,则需要登录到远程服务器,在磁盘上找到日志文件,然后浏览它们以查找问题。如果您有多个 Web 服务器,那么您将面临一项艰巨的工作来获取所有日志,然后才能开始处理错误 — 假设您甚至可以远程访问生产服务器!不好玩。再加上文件权限或驱动器空间问题的可能性,文件日志记录似乎不那么有吸引力。
Instead, it’s often better to send your logs to a centralized location, separate from your application. Exactly where this location may be is up to you; the key is that each instance of your app sends its logs to the same location, separate from the app itself.
相反,通常最好将日志发送到与应用程序分开的集中位置。这个位置的确切位置取决于您;关键是应用程序的每个实例都将其日志发送到同一位置,与应用程序本身分开。
If you’re running your app on Microsoft Azure, you get centralized logging for free because you can collect logs using the Azure App Service provider. Alternatively, you could send your logs to a third-party log aggregator service such as elmah.io (https://elmah.io) or Seq (https://getseq.net). You can find ASP.NET Core logging providers for each of these services on NuGet, so adding them is the same process as adding the file provider you’ve seen already.
如果您在 Microsoft Azure 上运行应用程序,则可以免费获得集中式日志记录,因为您可以使用 Azure 应用程序服务提供商收集日志。或者,您也可以将日志发送到第三方日志聚合器服务,例如 elmah.io (https://elmah.io) 或 Seq (https://getseq.net)。可以在 NuGet 上找到每个服务的 ASP.NET Core 日志记录提供程序,因此添加它们的过程与添加已看到的文件提供程序的过程相同。
Whichever providers you add, once you start running your apps in production, you’ll quickly discover a new problem: the sheer number of log messages your app generates! In the next section you’ll learn how to keep this under control without affecting your local development.
无论您添加哪个提供商,一旦您开始在生产环境中运行应用程序,您很快就会发现一个新问题:您的应用程序生成的日志消息数量庞大!在下一节中,您将学习如何在不影响本地开发的情况下控制这种情况。
26.4 Changing log verbosity with filtering
26.4 通过过滤更改日志详细程度
In this section you’ll see how to reduce the number of log messages written to the logger providers. You’ll learn how to apply a base level filter, filter out messages from specific namespaces, and use logging provider-specific filters.
在本节中,您将了解如何减少写入 Logger 提供程序的日志消息数量。您将学习如何应用基本级别的过滤器、过滤掉来自特定命名空间的消息以及使用特定于日志记录提供商的过滤器。
If you’ve been playing around with the logging samples, you’ll probably have noticed that you get a lot of log messages, even for a single request like the one in figure 26.2: messages from the Kestrel server and messages from EF Core, not to mention your own custom messages. When you’re debugging locally, having access to all that detailed information is extremely useful, but in production you’ll be so swamped by noise that picking out the important messages will be difficult.
如果您一直在使用日志记录示例,则可能已经注意到,即使对于如图 26.2 所示的单个请求:来自 Kestrel 服务器的消息和来自 EF Core 的消息,您也会收到大量日志消息,更不用说您自己的自定义消息了。在本地调试时,访问所有这些详细信息非常有用,但在生产环境中,您将被噪音所淹没,以至于很难挑选出重要的消息。
ASP.NET Core includes the ability to filter out log messages before they’re written, based on a combination of three things:
ASP.NET Core 包括在写入日志消息之前根据以下三项组合筛选出日志消息的功能:
• The log level of the message
消息的日志级别
• The category of the logger (who created the log)
记录器的类别(创建日志的人)
• The logger provider (where the log will be written)
记录器提供程序(将写入日志的位置)
You can create multiple rules using these properties, and for each log that’s created, the most specific rule is applied to determine whether the log should be written to the output. You could create the following three rules:
您可以使用这些属性创建多个规则,对于创建的每个日志,将应用最具体的规则来确定是否应将日志写入输出。您可以创建以下三条规则:
• The default minimum log level is Information. If no other rules apply, only logs with a log level of Information or above will be written to providers.
默认的最小日志级别为 Information。如果没有其他规则适用,则只会将日志级别为 Information 或更高的日志写入提供程序。
• For categories that start with Microsoft, the minimum log level is Warning. Any logger created in a namespace that starts with Microsoft will write only logs that have a log level of Warning or above. This would filter out the noisy framework messages you saw in figure 26.6.
对于以 Microsoft 开头的类别,最低日志级别为“警告”。在以 Microsoft 开头的命名空间中创建的任何 Logger 都将仅写入日志级别为 Warning 或更高的日志。这将过滤掉你在图 26.6 中看到的嘈杂的框架消息。
• For the console provider, the minimum log level is Error. Logs written to the console provider must have a minimum log level of Error. Logs with a lower level won’t be written to the console, though they might be written using other providers.
对于控制台提供商,最低日志级别为 Error。写入控制台提供程序的日志必须具有 Error (错误) 的最低日志级别。具有较低级别的日志不会写入控制台,尽管它们可能是使用其他提供程序写入的。
Typically, the goal with log filtering is to reduce the number of logs written to certain providers or from certain namespaces (based on the log category). Figure 26.8 shows a possible set of filtering rules that apply to the console and file logging providers.
通常,日志筛选的目标是减少写入某些提供程序或某些命名空间(基于日志类别)的日志数量。图 26.8 显示了一组可能的过滤规则,这些规则适用于控制台和文件日志记录提供程序。
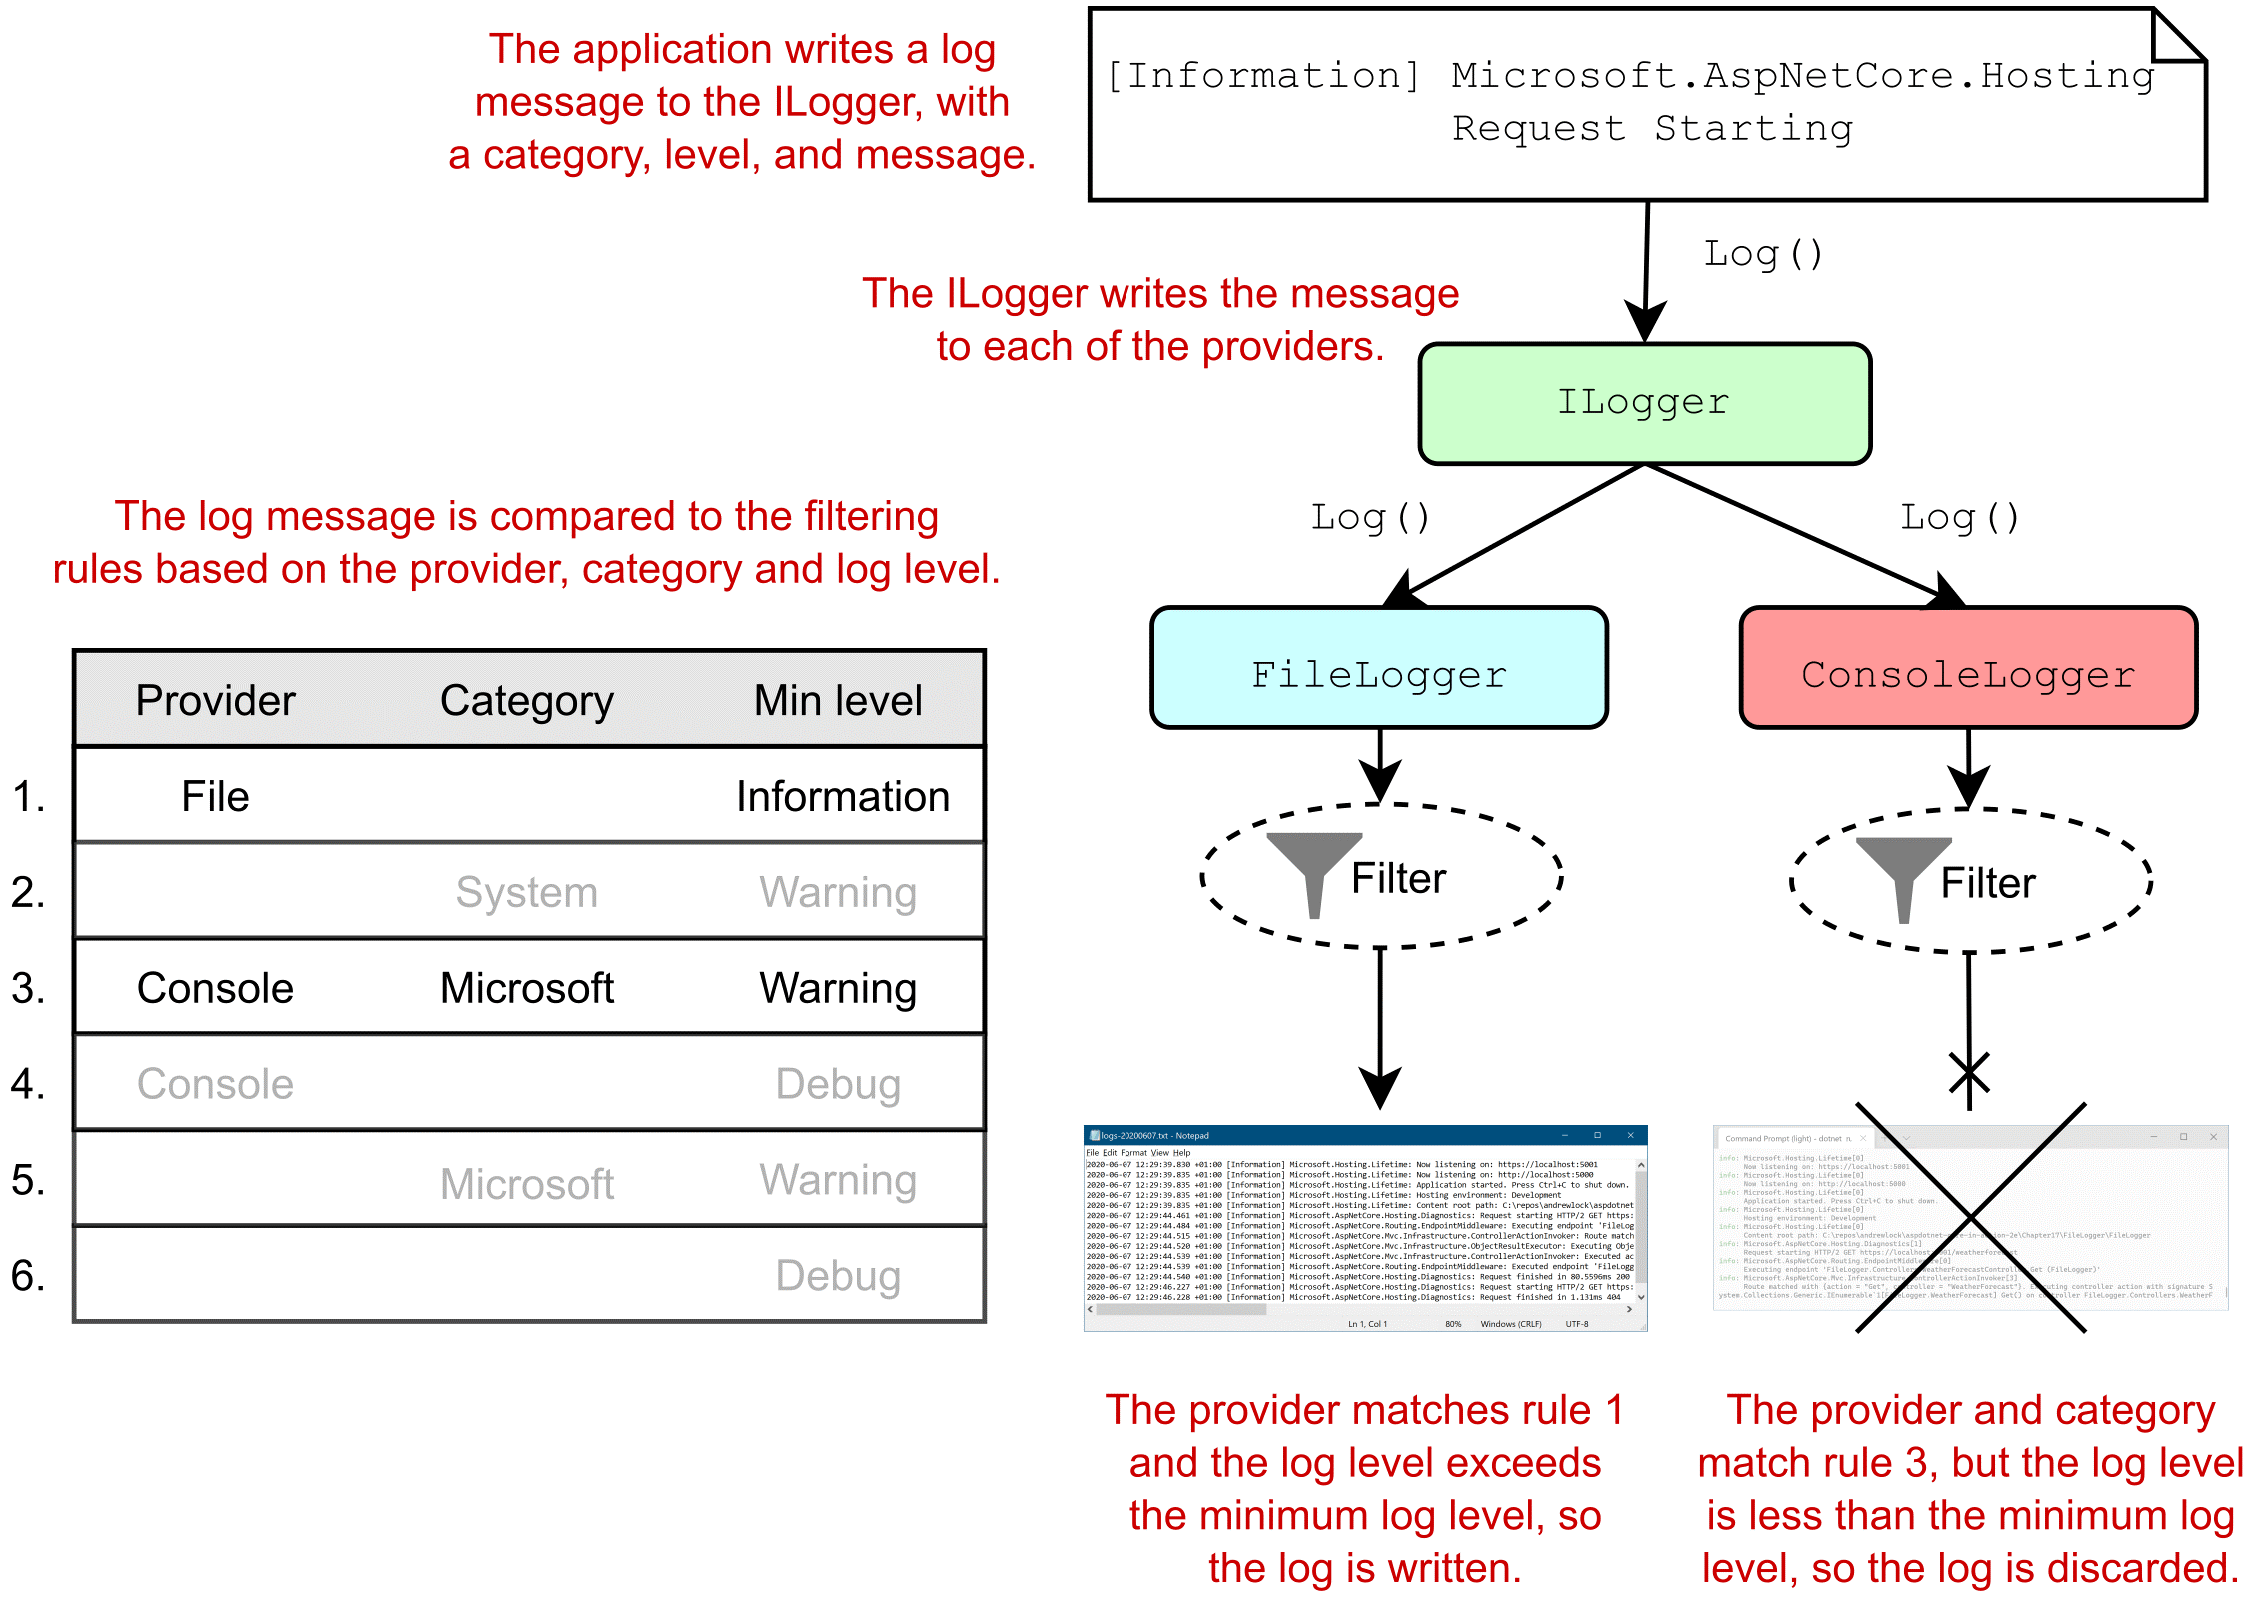
Figure 26.8 Applying filtering rules to a log message to determine whether a log should be written. For each provider, the most specific rule is selected. If the log exceeds the rule’s required minimum level, the provider writes the log; otherwise, it discards it.
图 26.8 将过滤规则应用于日志消息以确定是否应写入日志。对于每个提供商,将选择最具体的规则。如果日志超过规则所需的最低级别,则提供程序将写入日志;否则,它将丢弃它。
In this example, the console logger explicitly restricts logs written in the Microsoft namespace to Warning or above, so the console logger ignores the log message shown. Conversely, the file logger doesn’t have a rule that explicitly restricts the Microsoft namespace, so it uses the configured minimum level of Information and writes the log to the output.
在此示例中,控制台记录器明确将 Microsoft 命名空间中写入的日志限制为 Warning 或更高级别,因此控制台记录器会忽略显示的日志消息。相反,文件记录器没有明确限制 Microsoft 命名空间的规则,因此它使用配置的最低级别 Information 并将日志写入输出。
TIP Only a single rule is chosen when deciding whether a log message should be written; rules aren’t combined. In figure 26.8, rule 1 is considered to be more specific than rule 5, so the log is written to the file provider, even though technically, both rules could apply.
提示:在决定是否应写入日志消息时,只选择一个规则;规则不会合并。在图 26.8 中,规则 1 被认为比规则 5 更具体,因此日志被写入文件提供程序,即使从技术上讲,这两个规则都适用。
You typically define your app’s set of logging rules using the layered configuration approach discussed in chapter 10, because this lets you easily have different rules when running in development and production.
您通常使用第 10 章中讨论的分层配置方法来定义应用程序的日志记录规则集,因为这可以让您在开发和生产环境中运行时轻松拥有不同的规则。
TIP As you saw in chapter 11, you can load configuration settings from multiple sources, like JSON files and environment variables, and can load them conditionally based on the IHostingEnvironment. A common practice is to include logging settings for your production environment in appsettings.json and overrides for your local development environment in appsettings.Development.json.
提示:正如您在第 11 章中所看到的,您可以从多个源(如 JSON 文件和环境变量)加载配置设置,并且可以基于 IHostingEnvironment 有条件地加载它们。一种常见的做法是在 appsettings.json 中包含生产环境的日志记录设置,并在 appsettings 中包含本地开发环境的覆盖。Development.json。
WebApplicationBuilder automatically loads configuration rules from the "Logging" section of the IConfiguration object. This happens automatically, and you rarely need to customize it, but listing 26.6 shows how you could also add configuration rules from the "LoggingRules" section using AddConfiguration().
WebApplicationBuilder 会自动从 IConfiguration 对象的 “Logging” 部分加载配置规则。这是自动发生的,您很少需要自定义它,但是清单 26.6 显示了如何使用 AddConfiguration() 从 “LoggingRules” 部分添加配置规则。
NOTE WebApplicationBuilder always adds the configuration to load from the "Logging" section; you can’t remove this. For this reason, it’s rarely worth adding configuration yourself; instead, use the default "Logging" configuration section where possible.
注意:WebApplicationBuilder 始终从 “Logging” 部分添加要加载的配置;您无法删除此内容。因此,您自己添加配置很少值得;相反,请尽可能使用默认的 “Logging” 配置部分。
Listing 26.6 Loading logging configuration using AddConfiguration()
列表 26.6 使用 AddConfiguration() 加载日志配置
WebApplicationBuilder builder = WebApplication.CreateBuilder(args);
builder.Logging.AddConfiguration(
    builder.Configuration.GetSection("LoggingRules")); ❶

var app = builder.Build();

app.MapGet("/", () => "Hello world!");
app.Run();
❶ Loads the log filtering configuration from the LoggingRules section
从 LoggingRules 部分加载日志过滤配置
Assuming that you don’t override the configuration section, your appsettings.json will typically contain a "Logging" section, which defines the configuration rules for your app. Listing 26.8 shows how this might look to define all the rules shown in figure 26.8.
假设你没有覆盖 configuration 部分,你的 appsettings.json 通常会包含一个 “Logging” 部分,它定义了你的应用程序的配置规则。清单 26.8 显示了如何定义图 26.8 中所示的所有规则。
Listing 26.7 The log filtering configuration section of appsettings.json
清单 26.7 appsettings.json 的日志过滤配置部分
{
  "Logging": {
    "LogLevel": {             #A
      "Default": "Debug",     #A
      "System": "Warning",    #A
      "Microsoft": "Warning"  #A
    },
    "File": {                      #B
      "LogLevel": {                #B
        "Default": "Information"   #B
      }
    },
    "Console": {                 #C
      "LogLevel": {              #C
        "Default": "Debug",      #C
        "Microsoft": "Warning"   #C
      }
    }
  }
}
❶ Rules to apply if there are no specific rules for a provider
如果提供程序没有特定规则,则要应用的规则
❷ Rules to apply to the File provider
应用于文件提供程序的规则
❸ Rules to apply to the Console provider
应用于控制台提供程序的规则
When creating your logging rules, the important thing to bear in mind is that if you have any provider-specific rules, these will take precedence over the category-based rules defined in the "LogLevel" section. Therefore, for the configuration defined in listing 26.7, if your app uses only the file or console logging providers, the rules in the "LogLevel" section will effectively never apply.
在创建日志记录规则时,要记住的重要一点是,如果您有任何特定于提供程序的规则,这些规则将优先于 “LogLevel” 部分中定义的基于类别的规则。因此,对于清单 26.7 中定义的配置,如果您的应用程序仅使用文件或控制台日志记录提供程序,则“LogLevel”部分中的规则实际上将永远不会适用。
If you find this confusing, don’t worry; so do I. Whenever I’m setting up logging, I check the algorithm used to determine which rule applies for a given provider and category, which is as follows:
如果您觉得这令人困惑,请不要担心;我也是。每当我设置日志记录时,我都会检查用于确定哪个规则适用于给定提供程序和类别的算法,如下所示:
-
Select all rules for the given provider. If no rules apply, select all rules that don’t define a provider (the top "LogLevel" section from listing 26.7).
选择给定提供程序的所有规则。如果没有适用的规则,请选择所有未定义提供程序的规则(清单 26.7 中的顶部“LogLevel”部分)。 -
From the selected rules, select rules with the longest matching category prefix. If no selected rules match the category prefix, select the "Default" if present.
从所选规则中,选择具有最长匹配类别前缀的规则。如果没有选定的规则与类别前缀匹配,请选择“Default”(默认)(如果存在)。 -
If multiple rules are selected, use the last one.
如果选择了多个规则,请使用最后一个规则。 -
If no rules are selected, use the global minimum level, "LogLevel:Default" (Debug in listing 26.7).
如果未选择任何规则,请使用全局最小级别 “LogLevel:Default” (列表 26.7 中的 Debug)。
Each of these steps except the last narrows down the applicable rules for a log message until you’re left with a single rule. You saw this in effect for a "Microsoft" category log in figure 26.8. Figure 26.9 shows the process in more detail.
除最后一个步骤外,这些步骤中的每一个步骤都会缩小日志消息的适用规则范围,直到您只剩下一条规则。您在图 26.8 中看到了 “Microsoft” 类别日志的效果。图 26.9 更详细地显示了该过程。
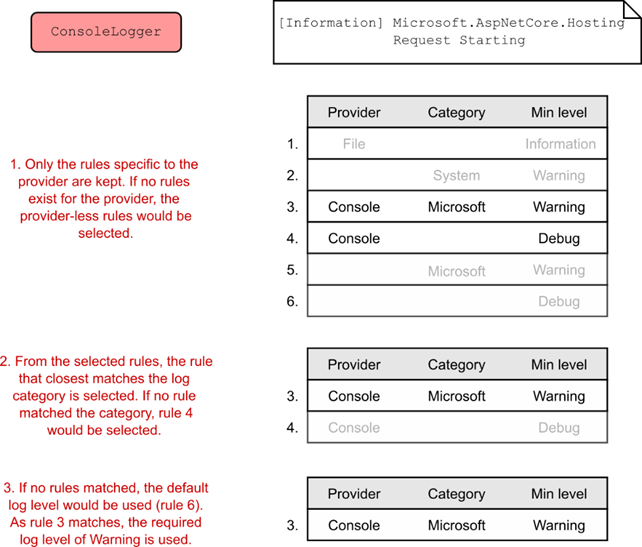
Figure 26.9 Selecting a rule to apply from the available set for the console provider and an Information level log. Each step reduces the number of rules that apply until you’re left with only one.
图 26.9 从控制台提供程序的可用集和信息级别日志中选择要应用的规则。每个步骤都会减少适用的规则数,直到只剩下一个规则。
WARNING Log filtering rules aren’t merged; a single rule is selected. Including provider-specific rules will override global category-specific rules, so I tend to stick to category-specific rules where possible to make the overall set of rules easier to understand.
警告:日志筛选规则不会合并;将选择单个规则。包含特定于提供商的规则将覆盖全局特定于类别的规则,因此我倾向于尽可能坚持使用特定于类别的规则,以使整个规则集更易于理解。
With some effective filtering in place, your production logs should be much more manageable, as shown in figure 26.10. Generally, I find it’s best to limit the logs from the ASP.NET Core infrastructure and referenced libraries to Warning or above while keeping logs that my app writes to Debug in development and Information in production.
通过一些有效的过滤,您的 生产日志应该更易于管理,如图 26.10 所示。通常,我发现最好将来自 ASP.NET Core 基础设施和引用库的日志限制为 Warning 或更高级别,同时保留我的应用程序写入 Debug in development 和 Information in production的日志。
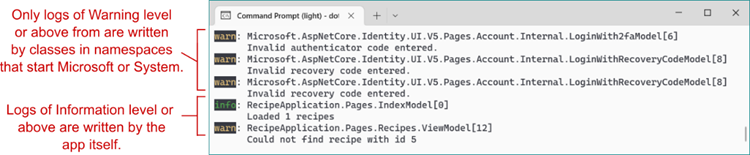
Figure 26.10 Using filtering to reduce the number of logs written. In this example, category filters have been added to the Microsoft and System namespaces, so only logs of Warning and above are recorded. That increases the proportion of logs that are directly relevant to your application.
图 26.10 使用过滤来减少写入的日志数量。在此示例中,类别筛选器已添加到 Microsoft 和 System 命名空间,因此仅记录 Warning 及以上的日志。这会增加与您的应用程序直接相关的日志的比例。
This is close to the default configuration used in the ASP.NET Core templates. You may find you need to add additional category-specific filters, depending on which NuGet libraries you use and the categories they write to. The best way to find out is generally to run your app and see whether you get flooded with uninteresting log messages.
这接近 ASP.NET Core 模板中使用的默认配置。你可能会发现需要添加其他特定于类别的筛选器,具体取决于你使用的 NuGet 库以及它们写入的类别。找出答案的最佳方法通常是运行您的应用程序,看看您是否被不感兴趣的日志消息淹没。
TIP Most logging providers listen for configuration changes and update their filters dynamically. That means you should be able to modify your appsettings.json or appsettings.Development.json file and check the effect on the log messages, iterating quickly without restarting your app.
提示:大多数日志记录提供程序侦听配置更改并动态更新其过滤器。这意味着您应该能够修改 appsettings.json 或 appsettings。Development.json文件并检查对日志消息的影响,在不重新启动应用程序的情况下快速迭代。
Even with your log verbosity under control, if you stick to the default logging providers like the file or console loggers, you’ll probably regret it in the long run. These log providers work perfectly well, but when it comes to finding specific error messages or analyzing your logs, you’ll have your work cut out for you. In the next section you’ll see how structured logging can help you tackle this problem.
即使你的日志详细程度得到控制,如果你坚持使用默认的日志提供程序,如文件或控制台记录器,从长远来看,你可能会后悔。这些日志提供程序运行良好,但是在查找特定错误消息或分析日志时,您将需要完成大量工作。在下一节中,您将了解结构化日志记录如何帮助您解决这个问题。
26.5 Structured logging: Creating searchable, useful logs
26.5 结构化日志记录:创建可搜索的有用日志
In this section you’ll learn how structured logging makes working with log messages easier. You’ll learn to attach key-value pairs to log messages and how to store and query for key values using the structured logging provider Seq. Finally, you’ll learn how to use scopes to attach key-value pairs to all log messages within a block.
在本节中,您将了解结构化日志记录如何更轻松地处理日志消息。您将学习如何将键值对附加到日志消息,以及如何使用结构化日志记录提供程序 Seq 存储和查询键值。最后,您将学习如何使用范围将键值对附加到块中的所有日志消息。
Let’s imagine you’ve rolled out the recipe application we’ve been working on to production. You’ve added logging to the app so that you can keep track of any errors in your application, and you’re storing the logs in a file.
假设您已经将我们一直在开发的配方应用程序推广到生产环境中。您已将日志记录添加到应用程序,以便您可以跟踪应用程序中的任何错误,并且您将日志存储在文件中。
One day, a customer calls and says they can’t view their recipe. Sure enough, when you look through the log messages, you a see a warning:
有一天,一位客户打电话说他们无法查看他们的配方。果然,当您查看日志消息时,您会看到一条警告:
warn: RecipeApplication.Pages.Recipes.ViewModel [12]
      Could not find recipe with id 3245
This piques your interest. Why did this happen? Has it happened before for this customer? Has it happened before for this recipe? Has it happened for other recipes? Does it happen regularly?
这激起了您的兴趣。为什么会这样?此客户以前发生过吗?这个食谱以前发生过吗?其他食谱也发生过吗?它经常发生吗?
How would you go about answering these questions? Given that the logs are stored in a text file, you might start doing basic text searches in your editor of choice, looking for the phrase "Could not find recipe with id". Depending on your notepad-fu skills, you could probably get a fair way in answering your questions, but it would likely be a laborious, error-prone, and painful process.
您将如何回答这些问题?鉴于日志存储在文本文件中,您可以开始在所选编辑器中进行基本文本搜索,查找短语“Could not find recipe with id”。根据你的记事本技能,你可能会得到一个公平的方式来回答你的问题,但这可能是一个费力、容易出错和痛苦的过程。
The limiting factor is that the logs are stored as unstructured text, so text processing is the only option available to you. A better approach is to store the logs in a structured format so that you can easily query the logs, filter them, and create analytics. Structured logs could be stored in any format, but these days they’re typically represented as JSON. A structured version of the same recipe warning log might look something like this:
限制因素是日志存储为非结构化文本,因此文本处理是您唯一可用的选项。更好的方法是以结构化格式存储日志,以便您可以轻松查询日志、筛选日志并创建分析。结构化日志可以以任何格式存储,但现在它们通常表示为 JSON。同一配方警告日志的结构化版本可能如下所示:
{
  "eventLevel": "Warning",
  "category": "RecipeApplication.Pages.Recipes.ViewModel",
  "eventId": "12",
  "messageTemplate": "Could not find recipe with {recipeId}",
  "message": "Could not find recipe with id 3245",
  "recipeId": "3245"
}
This structured log message contains all the same details as the unstructured version, but in a format that would easily let you search for specific log entries. It makes it simple to filter logs by their EventLevel or to show only those logs relating to a specific recipe ID.
此结构化日志消息包含与非结构化版本相同的所有详细信息,但格式可让您轻松搜索特定日志条目。它使按日志的 EventLevel 筛选日志或仅显示与特定配方 ID 相关的日志变得简单。
NOTE This is only an example of what a structured log could look like. The format used for the logs will vary depending on the logging provider used and could be anything. The main point is that properties of the log are available as key-value pairs.
注意:这只是结构化日志的一个示例。用于日志的格式将根据所使用的日志记录提供程序而有所不同,可以是任何内容。要点是日志的属性可用作键值对。
Adding structured logging to your app requires a logging provider that can create and store structured logs. Elasticsearch is a popular general search and analytics engine that can be used to store and query your logs. One big advantage of using a central store such as Elasticsearch is the ability to aggregate the logs from all your apps in one place and analyze them together. You can add the Elasticsearch.Extensions.Logging provider to your app in the same way as you added the file sink in section 26.3.
向应用添加结构化日志记录需要可以创建和存储结构化日志的日志记录提供程序。Elasticsearch 是一种流行的通用搜索和分析引擎,可用于存储和查询您的日志。使用 Elasticsearch 等中央存储的一大优势是能够将来自所有应用程序的日志聚合到一个位置并一起分析它们。您可以按照在第 26.3 节中添加文件接收器的相同方式将 Elasticsearch.Extensions.Logging 提供程序添加到您的应用程序中。
NOTE Elasticsearch is a REST-based search engine that’s often used for aggregating logs. You can find out more at https://www.elastic.co/elasticsearch.
注意:Elasticsearch 是一个基于 REST 的搜索引擎,通常用于聚合日志。您可以在 https://www.elastic.co/elasticsearch 了解更多信息。
Elasticsearch is a powerful production-scale engine for storing your logs, but setting it up and running it in production isn’t easy. Even after you’ve got it up and running, there’s a somewhat steep learning curve associated with the query syntax. If you’re interested in something more user-friendly for your structured logging needs, Seq (https://getseq.net) is a great option. In the next section I’ll show you how adding Seq as a structured logging provider makes analyzing your logs that much easier.
Elasticsearch 是一个强大的生产规模引擎,用于存储您的日志,但在生产环境中设置和运行它并不容易。即使在您启动并运行它之后,与查询语法相关的学习曲线也会有些陡峭。如果您对更用户友好的结构化日志记录需求感兴趣,Seq (https://getseq.net) 是一个不错的选择。在下一节中,我将向您展示将 Seq 添加为结构化日志记录提供程序如何使分析日志变得更加容易。
26.5.1 Adding a structured logging provider to your app
26.5.1 向应用程序添加结构化日志记录提供程序
To demonstrate the advantages of structured logging, in this section you’ll configure an app to write logs to Seq. You’ll see that the configuration is essentially identical to unstructured providers, but the possibilities afforded by structured logging make considering it a no-brainer.
为了演示结构化日志记录的优势,在本节中,您将配置一个应用程序以将日志写入 Seq。您将看到该配置与非结构化提供程序基本相同,但结构化日志记录提供的可能性使得考虑它变得轻而易举。
Seq is installed on a server or your local machine and collects structured log messages over HTTP, providing a web interface for you to view and analyze your logs. It is currently available as a Windows app or a Linux Docker container. You can install a free version for development, which allows you to experiment with structured logging in general.
Seq 安装在服务器或本地计算机上,通过 HTTP 收集结构化日志消息,为您提供一个 Web 界面来查看和分析您的日志。它目前以 Windows 应用程序或 Linux Docker 容器的形式提供。您可以安装用于开发的免费版本,这样您就可以尝试一般的结构化日志记录。
TIP You can download Seq from https://getseq.net/Download.
提示:您可以从 https://getseq.net/Download 下载 Seq。
From the point of view of your app, the process for adding the Seq provider should be familiar:
从应用程序的角度来看,添加 Seq 提供程序的过程应该很熟悉:
- Install the Seq logging provider using Visual Studio or the .NET CLI with
使用 Visual Studio 或 .NET CLI 安装 Seq 日志记录提供程序
dotnet add package Seq.Extensions.Logging- Add the Seq logging provider in Program.cs. To add the Seq provider call AddSeq():
在 Program.cs 中添加 Seq 日志记录提供程序。要添加 Seq 提供程序,请调用 AddSeq():
WebApplicationBuilder builder = WebApplication.CreateBuilder(args);
builder.Logging.AddSeq();
That’s all you need to add Seq to your app. This will send logs to the default local URL when you have Seq installed in your local environment. The AddSeq() extension method includes additional overloads to customize Seq when you move to production, but this is all you need to start experimenting locally.
这就是将 Seq 添加到您的应用程序所需的全部内容。当您在本地环境中安装了 Seq 时,这会将日志发送到默认的本地 URL。AddSeq() 扩展方法包括额外的重载,以便在您迁移到生产环境时自定义 Seq,但这就是您开始在本地实验所需的全部内容。
If you haven’t already, install Seq on your development machine (or run the Docker container) and navigate to the Seq app at http://localhost:5341. In a different tab, open your app, and start browsing your app and generating logs. Back in Seq, if you refresh the page, you’ll see a list of logs, something like figure 26.11. Clicking a log expands it and shows you the structured data recorded for the log.
如果您尚未在开发计算机上安装 Seq(或运行 Docker 容器),并在 http://localhost:5341 导航到 Seq 应用程序。在另一个选项卡中,打开您的应用,然后开始浏览您的应用并生成日志。回到 Seq,如果你刷新页面,你会看到一个日志列表,类似于图 26.11。单击日志可将其展开,并显示为该日志记录的结构化数据。
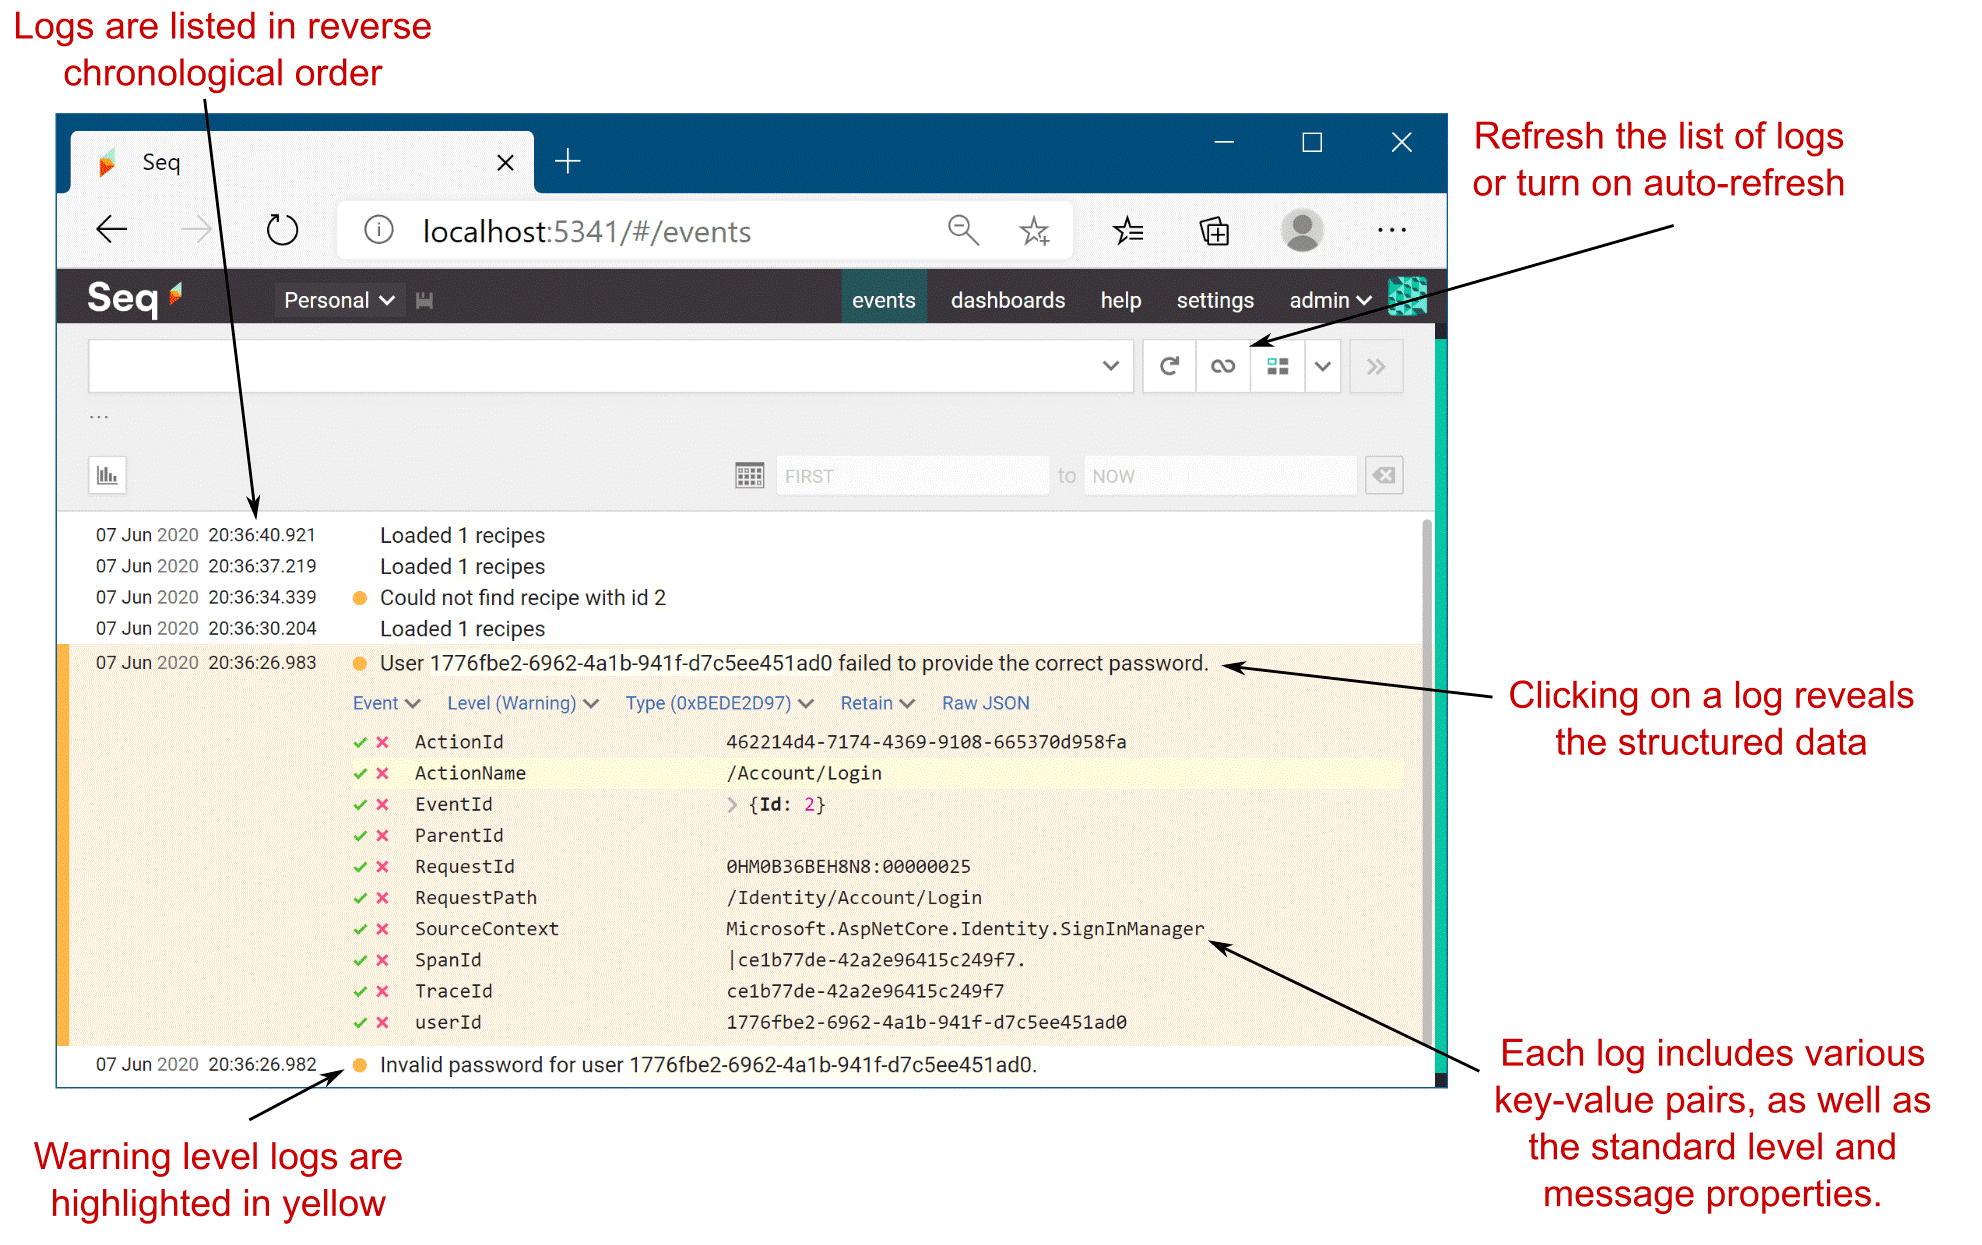
Figure 26.11 The Seq UI. Logs are presented as a list. You can view the structured logging details of individual logs, view analytics for logs in aggregate, and search by log properties.
图 26.11 Seq UI。日志以列表形式显示。您可以查看单个日志的结构化日志记录详细信息,查看聚合日志的分析,并按日志属性进行搜索。
ASP.NET Core supports structured logging by treating each captured parameter from your message format string as a key-value pair. If you create a log message using the following format string,
ASP.NET Core 通过将消息格式字符串中捕获的每个参数视为键值对来支持结构化日志记录。如果使用以下格式字符串创建日志消息,
_log.LogInformation("Loaded {RecipeCount} recipes", Recipes.Count);the Seq logging provider creates a RecipeCount parameter with a value of Recipes.Count. These parameters are added as properties to each structured log, as you can see in figure 26.11.
Seq 日志记录提供程序会创建一个值为 Recipes.Count 的 RecipeCount 参数。这些参数作为属性添加到每个结构化日志中,如图 26.11 所示。
Structured logs are generally easier to read than your standard-issue console output, but their real power comes when you need to answer a specific question. Consider the problem from before, where you see this error:
结构化日志通常比标准问题控制台输出更易于阅读,但当您需要回答特定问题时,它们的真正功能就来了。考虑之前的问题,您会看到以下错误:
Could not find recipe with id 3245You want to get a feel for how widespread the problem is. The first step would be to identify how many times this error has occurred and to see whether it’s happened to any other recipes. Seq lets you filter your logs, but it also lets you craft SQL queries to analyze your data, so finding the answer to the question takes a matter of seconds, as shown in figure 26.12.
您想了解这个问题的普遍性。第一步是确定此错误发生了多少次,并查看任何其他配方是否发生过此错误。Seq 允许您过滤日志,但它也允许您制作 SQL 查询来分析数据,因此找到问题的答案需要几秒钟,如图 26.12 所示。
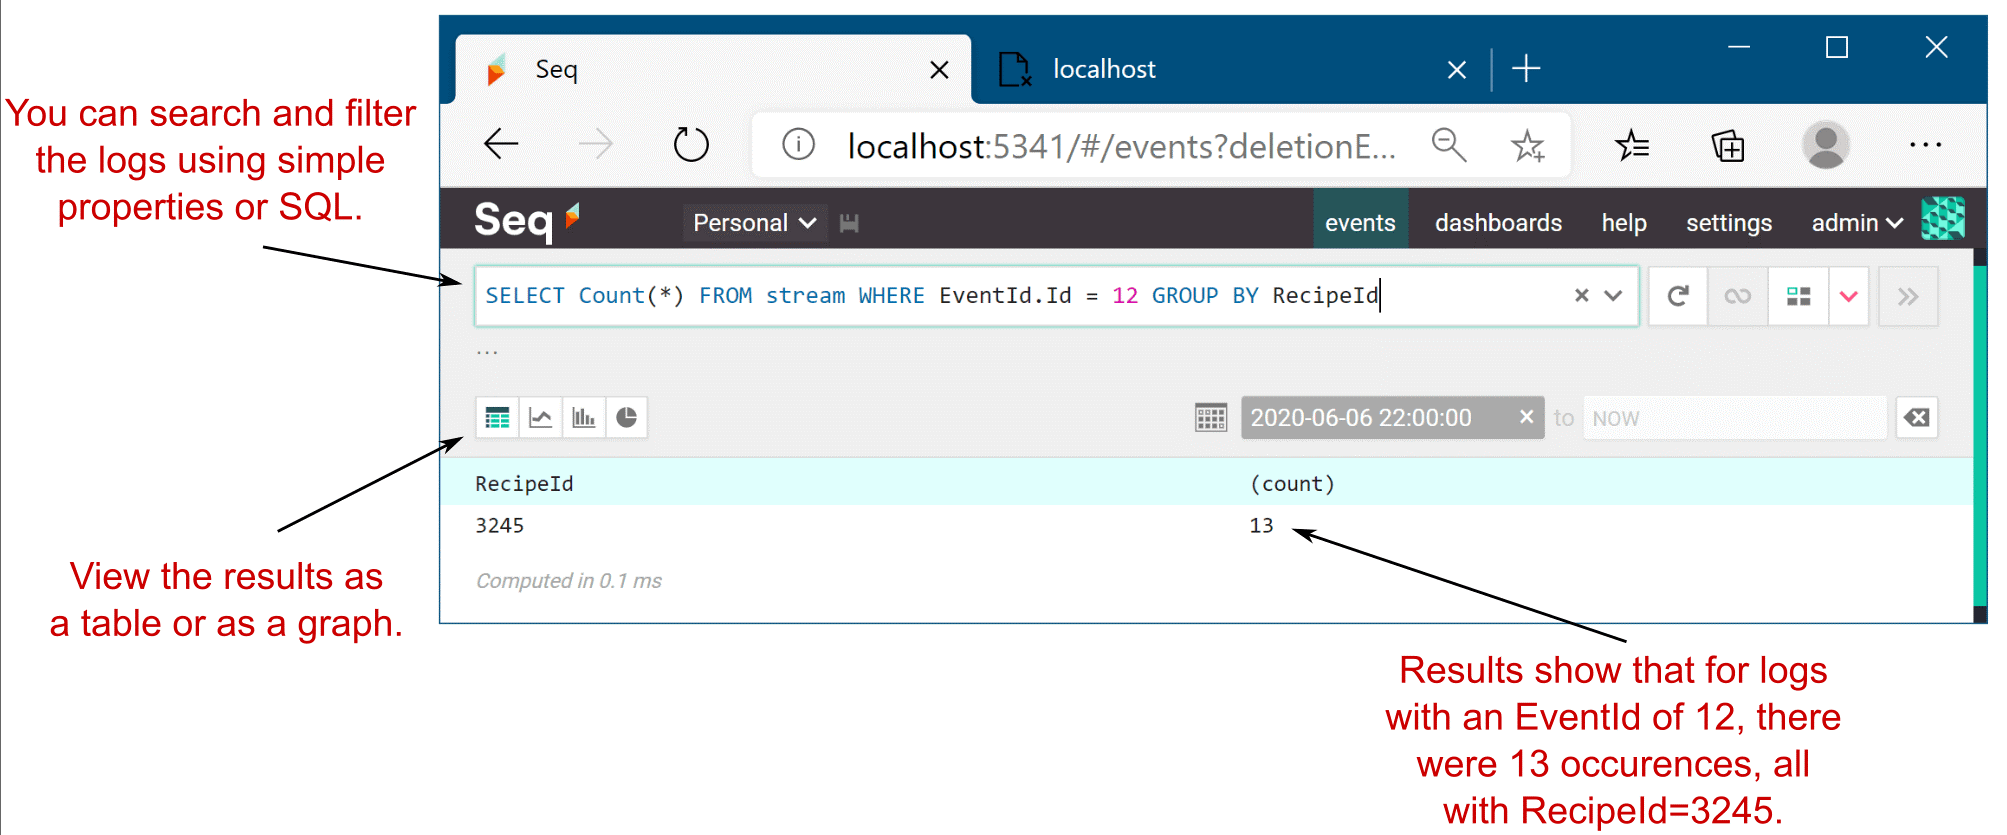
Figure 26.12 Querying logs in Seq. Structured logging makes log analysis like this example easy.
图 26.12 在 Seq 中查询日志。结构化日志记录使像这个例子一样的日志分析变得容易。
NOTE You don’t need query languages like SQL for simple queries, but they make digging into the data easier. Other structured logging providers may provide query languages other than SQL, but the principle is the same as in this Seq example.
注意:您不需要像 SQL 这样的查询语言进行简单的查询,但它们可以更轻松地挖掘数据。其他结构化日志记录提供程序可能会提供 SQL 以外的查询语言,但原理与此 Seq 示例中的相同。
A quick search shows that you’ve recorded the log message with EventId.Id=12 (the EventId of the warning we’re interested in) 13 times, and every time, the offending RecipeId was 3245. This suggests that there may be something wrong with that recipe specifically, which points you in the right direction to find the problem.
快速搜索显示,您已经使用 EventId.Id=12(我们感兴趣的警告的 EventId)记录了 13 次日志消息,每次违规的 RecipeId 都是 3245。这表明该配方可能存在问题,这为您指明了查找问题的正确方向。
More often than not, figuring out errors in production involves logging detective work like this to isolate where the problem occurred. Structured logging makes this process significantly easier, so it’s well worth considering, whether you choose Seq, Elasticsearch, or a different provider.
通常情况下,找出生产中的错误涉及记录此类侦探工作以隔离问题发生的位置。结构化日志记录使此过程变得更加容易,因此,无论您选择 Seq、Elasticsearch 还是其他提供商,都值得考虑。
I’ve already described how you can add structured properties to your log messages using variables and parameters from the message. But as you can see in figure 26.11, there are far more properties visible than exist in the message alone.
我已经介绍了如何使用消息中的变量和参数将结构化属性添加到日志消息中。但是正如你在图 26.11 中看到的,可见的属性比单独的消息中要多得多。
Scopes provide a way to add arbitrary data to your log messages. They’re available in some unstructured logging providers, but they shine when used with structured logging providers. In the final section of this chapter I’ll demonstrate how you can use them to add data to your log messages.
范围提供了一种将任意数据添加到日志消息的方法。它们在一些非结构化日志记录提供商中可用,但在与结构化日志记录提供商一起使用时,它们会大放异彩。在本章的最后一节中,我将演示如何使用它们向日志消息添加数据。
26.5.2 Using scopes to add properties to your logs
26.5.2 使用范围向日志添加属性
You’ll often find in your apps that you have a group of operations that all use the same data, which would be useful to attach to logs. For example, you might have a series of database operations that all use the same transaction ID, or you might be performing multiple operations with the same user ID or recipe ID. Logging scopes provide a way of associating the same data to every log message in such a group.
您经常会在应用程序中发现,有一组作都使用相同的数据,这对于附加到日志非常有用。例如,您可能有一系列数据库作,这些作都使用相同的事务 ID,或者您可能正在使用相同的用户 ID 或配方 ID 执行多个作。日志记录范围提供了一种将相同数据与此类组中的每个日志消息相关联的方法。
DEFINITION Logging scopes are used to group multiple operations by adding relevant data to multiple log message.
定义:日志记录范围用于通过将相关数据添加到多个日志消息来对多个作进行分组。
Logging scopes in ASP.NET Core are created by calling ILogger.BeginScope
ASP.NET Core 中的日志记录范围是通过调用 ILogger.BeginScope(T state) 并提供要记录的状态数据来创建的。您可以在 using 块中创建范围;写入 scope 块内的任何日志消息都将包含关联的数据,而 scope 块外的日志消息则没有。
Listing 26.8 Adding scope properties to log messages with BeginScope
示例 26.8 使用 BeginScope 添加 scope 属性以记录消息
_logger.LogInformation("No, I don't have scope");   #A
using(_logger.BeginScope("Scope value"))                #B
using(_logger.BeginScope(new Dictionary<string, object>     #C
    {{ "CustomValue1", 12345 } }))                          #C
{
    _logger.LogInformation("Yes, I have the scope!");    #D
}
_logger.LogInformation("No, I lost it again");      #A
❶ Log messages written outside the scope block don’t include the scope state.
在 scope 块之外写入的日志消息不包含 scope 状态。
❷ Calling BeginScope starts a scope block, with a scope state of “Scope value”.
调用 BeginScope 将启动一个范围块,其范围状态为“范围值”。
❸ You can pass anything as the state for a scope.
你可以将任何内容作为 scope 的状态传递。
❹ Log messages written inside the scope block include the scope state.
写入 scope 块内的日志消息包括 scope 状态。
The scope state can be any object at all: an int, a string, or a Dictionary, for example. It’s up to each logging provider implementation to decide how to handle the state you provide in the BeginScope call, but typically, it is serialized using ToString().
范围 state 可以是任何对象:例如 int、string 或 Dictionary。由每个日志记录提供程序实现决定如何处理您在 BeginScope 调用中提供的状态,但通常,它是使用 ToString() 序列化的。
TIP The most common use for scopes I’ve found is to attach additional key-value pairs to logs. To achieve this behavior in Seq, you need to pass Dictionary<string, object> as the state object. Nicholas Blumhardt, the creator of Serilog and Seq, has examples and the reasoning for this on his blog in the “The semantics of ILogger.BeginScope()” article: http://mng.bz/GxDD.
提示:我发现的 scope 最常见的用途是将额外的键值对附加到日志。要在 Seq 中实现此行为,您需要将 Dictionary<string, object> 作为状态对象传递。Serilog 和 Seq 的创建者 Nicholas Blumhardt 在他的博客“ILogger.BeginScope() 的语义”一文中提供了示例和原因:http://mng.bz/GxDD。
When the log messages inside the scope block are written, the scope state is captured and written as part of the log, as shown in figure 26.13. The Dictionary<> of key-value pairs is added directly to the log message (CustomValue1), and the remaining state values are added to the Scope property. You will likely find the dictionary approach the more useful of the two, as the added properties are more easily filtered on, as you saw in figure 26.12.
当写入 scope 块内的日志消息时,将捕获 scope 状态并将其作为日志的一部分写入,如图 26.13 所示。键值对的 Dictionary<> 将直接添加到日志消息 (CustomValue1) 中,其余状态值将添加到 Scope 属性中。你可能会发现字典方法在两者中更有用,因为添加的属性更容易过滤,如图 26.12 所示。
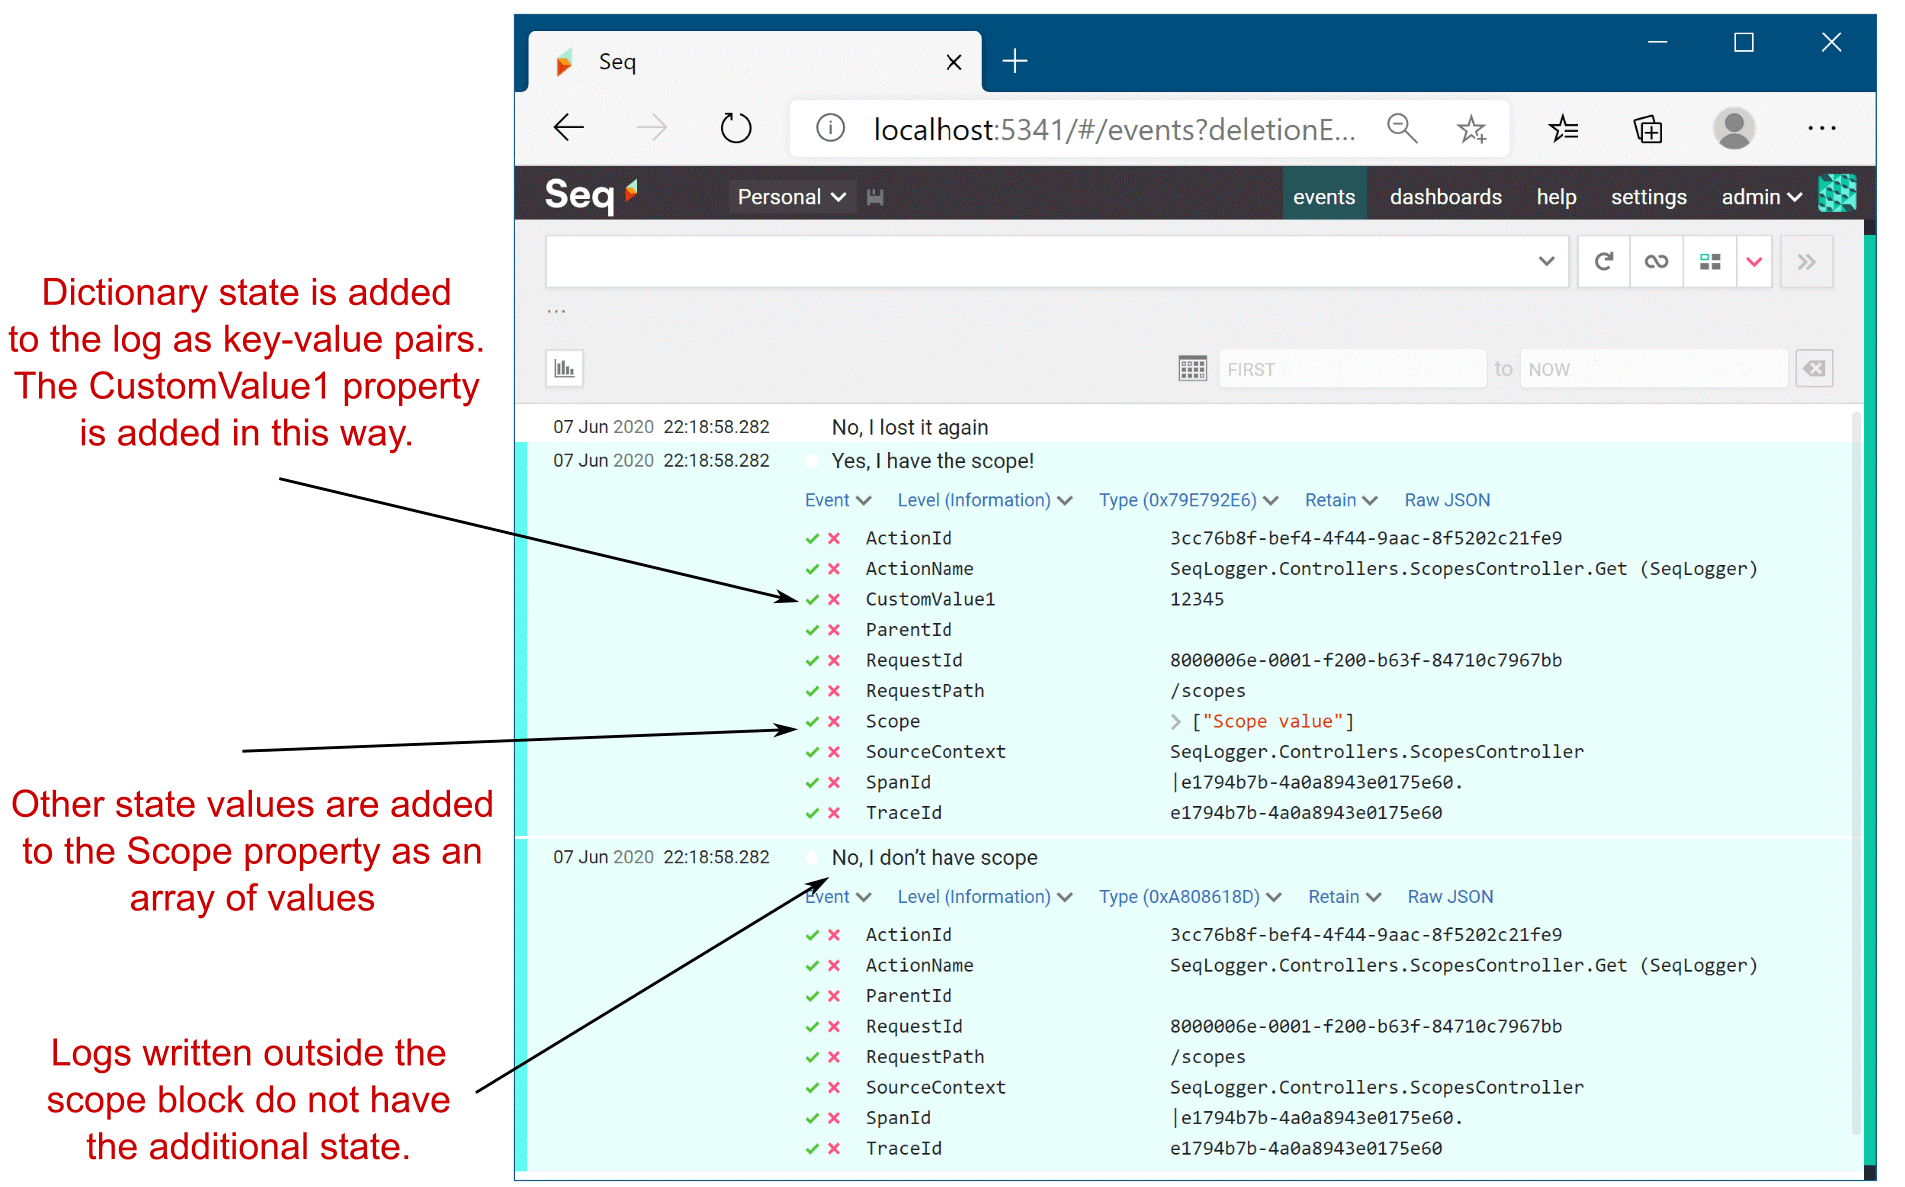
Figure 26.13 Adding properties to logs using scopes. Any scope state that is added using the dictionary approach is added as structured logging properties, but other state is added to the Scope property. Adding properties makes it easier to associate related logs with one another.
图 26.13 使用范围向日志添加属性。使用字典方法添加的任何范围状态都将添加为结构化日志记录属性,但其他状态将添加到 Scope 属性中。添加属性可以更轻松地将相关日志彼此关联。
That brings us to the end of this chapter on logging. Whether you use the built-in logging providers or opt to use a third-party provider like Serilog or NLog, ASP.NET Core makes it easy to get detailed logs not only for your app code, but also for the libraries that make up your app’s infrastructure, like Kestrel and EF Core. Whichever you choose, I encourage you to add more logs than you think you’ll need; you’ll thank me when it comes time to track down a problem.
这将我们带到了本章关于日志记录的结尾。无论您是使用内置日志记录提供程序,还是选择使用 Serilog 或 NLog 等第三方提供程序,ASP.NET Core 都可以轻松获取应用程序代码的详细日志,还可以轻松获取构成应用程序基础结构的库(如 Kestrel 和 EF Core)的详细日志。无论您选择哪种方式,我都鼓励您添加比您认为需要的更多的日志;当需要追踪问题时,您会感谢我。
In the next chapter we’re going to be looking at your ASP.NET Core application from a different point of view. Instead of focusing on the code and logic behind your app, we’re going to look at how you prepare an app for production. You’ll see how to specify the URLs your application uses and how to publish an app so that it can be hosted in IIS. Finally, you’ll learn about the bundling and minification of client-side assets, why you should care, and how to use BundlerMinifier in ASP.NET Core.
在下一章中,我们将从不同的角度看待您的 ASP.NET Core 应用程序。我们不会关注应用程序背后的代码和逻辑,而是要了解如何为生产准备应用程序。您将了解如何指定应用程序使用的 URL,以及如何发布应用程序,以便它可以托管在 IIS 中。最后,您将了解客户端资产的捆绑和缩小、为什么应该关注,以及如何在 ASP.NET Core 中使用 BundlerMinifier。
26.6 Summary
26.6 总结
Logging is critical for quickly diagnosing errors in production apps. You should always configure logging for your application so that logs are written to a durable location such as a filesystem or other service, not just to the console, where they will be lost if the window closes or the server restarts.
日志记录对于快速诊断生产应用程序中的错误至关重要。您应该始终为应用程序配置日志记录,以便将日志写入持久位置(如文件系统或其他服务),而不仅仅是写入控制台,如果窗口关闭或服务器重新启动,日志将丢失。
You can add logging to your own services by injecting ILogger
您可以通过注入 ILogger 将日志记录添加到您自己的服务中,其中 T 是服务的名称。或者,注入 ILoggerFactory 并调用 CreateLogger()。
The log level of a message indicates how important it is and ranges from Trace to Critical. Typically, you’ll create many low-importance log messages and a few high-importance log messages.
消息的日志级别表示它的重要性,范围从 Trace 到 Critical 不等。通常,您将创建许多低重要性的日志消息和一些高重要性的日志消息。
You specify the log level of a log by using the appropriate extension method of ILogger to create your log. To write an Information level log, use ILogger.LogInformation(message).
通过使用 ILogger 的相应扩展方法来指定日志的日志级别来创建日志。若要编写信息级别日志,请使用 ILogger.LogInformation(message)。
The log category indicates which component created the log. It is typically set to the fully qualified name of the class creating the log, but you can set it to any string if you wish. ILogger<T> will have a log category of T.
日志类别指示创建日志的组件。它通常设置为创建日志的类的完全限定名称,但您可以根据需要将其设置为任何字符串。ILogger<T> 的日志类别为 T。
You can format messages with placeholder values, similar to the string.Format method, but with meaningful names for the parameters. Calling logger.LogInfo("Loading Recipe with id {RecipeId}", 1234) would create a log reading "Loading Recipe with id 1234", but it would also capture the value RecipeId=1234. This structured logging makes analyzing log messages much easier.
您可以使用占位符值设置消息格式,类似于字符串。Format 方法,但参数具有有意义的名称。调用 logger。LogInfo(“Loading Recipe with id {RecipeId}”, 1234) 将创建一个日志,显示“Loading Recipe with id 1234”,但它也会捕获值 RecipeId=1234。这种结构化日志记录使分析日志消息变得更加容易。
ASP.NET Core includes many logging providers out of the box, including the console, debug, EventLog, and EventSource providers. Alternatively, you can add third-party logging providers.
ASP.NET Core 包含许多开箱即用的日志记录提供程序,包括 console、debug、EventLog 和 EventSource 提供程序。或者,您可以添加第三方日志记录提供商。
You can configure multiple ILoggerProvider instances in ASP.NET Core, which define where logs are output. WebApplicationBuilder adds the console and debug providers, and you can add providers using the Logging property.
您可以在 ASP.NET Core 中配置多个 ILoggerProvider 实例,这些实例定义日志的输出位置。WebApplicationBuilder 添加控制台和调试提供程序,您可以使用 Logging 属性添加提供程序。
You can control logging output verbosity using configuration. WebApplicationBuilder uses the "Logging" configuration section to control output verbosity. You typically filter out more logs in production than when developing your application.
您可以使用 configuration 控制日志记录输出的详细程度。WebApplicationBuilder 使用 “Logging” 配置部分来控制输出详细程度。与开发应用程序时相比,您在生产中筛选出的日志通常更多。
Only a single log filtering rule is selected for each logging provider when determining whether to output a log message. The most specific rule is selected based on the logging provider and the category of the log message.
在确定是否输出日志消息时,仅为每个日志记录提供程序选择一个日志筛选规则。根据日志记录提供程序和日志消息的类别选择最具体的规则。
Structured logging involves recording logs so that they can be easily queried and filtered, instead of the default unstructured format that’s output to the console. This makes analyzing logs, searching for problems, and identifying patterns easier.
结构化日志记录涉及记录日志,以便可以轻松查询和筛选日志,而不是输出到控制台的默认非结构化格式。这使得分析日志、搜索问题和识别模式变得更加容易。
You can add properties to a structured log by using scope blocks. A scope block is created by calling ILogger.BeginScope
您可以使用范围块将属性添加到结构化日志中。通过在 using 块中调用 ILogger.BeginScope(state) 来创建范围块。state 可以是任何对象,并添加到 scope 块内的所有日志消息中。